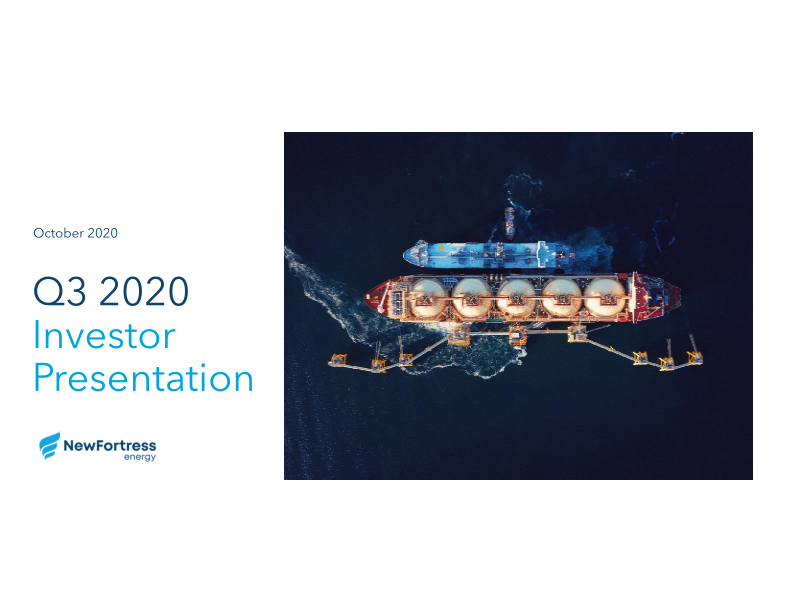
Espirito Santo Oil & Natural Gas Yearbook 2021

Made public by

Ideies/Findes

sourced by PitchSend

1 of 56

Creator

Ideies/Findes

Category

Energy

Published

2021

Slides

Transcriptions

#1Espírito Santo oil & natural gas yearbook 2021 FINDES POR VOCÊ PELA INDÚSTRIA, PELO ESPÍRITO SANTO IDEIES XX#2Empty#3PRESENTATION Federação das Indústrias do Estado do Espírito Santo - Findes Cristhine Samorini - President Serviço Nacional de Aprendizagem Industrial - Senai/ES Cláudio Marcassa - Regional Director Serviço Social da Indústria - Sesi/ES Cláudio Marcassa - Regional Superintendent Federação da Indústria do Estado do Espírito Santo - Findes Paulo Lacerda Almeida e Silva - General Director Research and Evaluation Executive Management - Sesi/ES and Senai/ES Marília Gabriela Elias da Silva - Executive Manager Instituto de Desenvolvimento Educacional e Industrial do Espírito Santo - Ideies Marília Gabriela Elias da Silva - Executive Manager Technical Team Gabriela Vichi Abel de Almeida - Manager of the Business Environment Observatory Mayara Lyra Bertolani - Studies and Research Analyst Nathan Marques Diirr - Studies and Research Analyst Thais Maria Mozer - Studies and Research Analyst Graphic Design, Layout, Review, and Illustration Curumim Vida Para Marcas - Text Review and Translation Brazil Translations Management of the Business Environment Observatory Av. Nossa Senhora da Penha, 2053, 3rd Floor, Santa Lúcia, Vitória, ES, Zip Code [CEP]: 29.056-913 (27) 3334-5626 [email protected] | www.portaldaindustria-es.com.br Receive our newsletter: (27) 98818-2897 Twitter | Linkedin | ideies | Instagram: @ideies Apoio: SEBRAE 4 Fórum Capixaba de Petróleo, Gás e Energia Espirito Santo Oil and Natural Gas Yearbook. Instituto de Desenvolvimento Educacional e Industrial do Espírito Santo - Vol. 5, 2022 - Espírito Santo: Ideies, 1971 - Annual ISSN 2595-9255 1. Oil & GAS. 2. Espírito Santo. 3. Industry. 4. Industrial Development. 5. Energy. CDU: 67(815.2) We are currently experiencing an intense period of changes relat- ed to the future of the planet. The term energy transition invaded the discussions between the different social actors, promoting changes in consumption habits and, also, greater demand from society for the acceleration of actions that promote the reduction of the im- pacts caused by the increase in the world's temperature. These aspira- tions come up to reduce the need for fossil energy consumption. There is no question about the benefits caused by the transition from an energy matrix intensive in fossil fuels to a matrix with low or zero carbon emissions. The doubts about this transition lie in the speed at which it will occur, given the need for energy securi- ty and the financial, technological, and regulatory stimuli to be pro- moted by global leaders. Recently, the world's attention has been directed to the geopolitical tensions involving oil and natural gas-producing countries. The situ- ation exposed the essential nature of energy security, highlighting the need for a decentralized, decarbon- ized, and digitalized energy matrix. It is in this context that the oil and natural gas sector will continue to be a fundamental part of the com- ing decades, being responsible for providing global energy security. The big oil companies have com- mitted to intensify the reduction of carbon emissions along with the in- put value chain, which represents a significant effort in the reduction of greenhouse gas emissions. Ensuring that information is a pre- cious asset, the 5th edition of the Espírito Santo Oil & Natural Gas Yearbook brings together the most important variables of analysis of the sector for Espírito Santo, com- bining technical rigor and structured, updated, and reliable information. The first chapter of the Year- book addresses the world oil and natural gas industry. Chapter 2 explains the oil and natural gas industry Espírito Santo. The consequences of these activities, focus on government participa- tion, are dealt with in Chapter 3. Chapter 4 discusses the Oil and Gas sector's incentive mecha- nism for Research, Development, and Innovation. Finally, chapter 5 points out the new opportunities in oil and natural gas exploration and production for Espírito Santo. For this year, the novelties consist of the inclusion of analyses of nat- ural gas and the presentation of an exercise for the projection of oil and natural gas production in Espírito Santo. Ideies reaffirms its commit- ment to the sector and Espírito San- to industry, keeping the Panel - Oil and Gas Industry - updated, which contains the most relevant data in the sector in a digital, intuitive, and dynamic format. In addition, we present the official map of the sec- tor, in partnership with the National Agency of Petroleum, Natural Gas, and Biofuels (ANP). Good Reading! Marília Gabriela Elias da Silva Executive Manager of Ideies SCAN ME SCAN ME ACESSE AQUI O PAINEL - INDÚSTRIA DO PETRÓLEO E GÁS ACCESS THE PORTUGUESE EDITION OF THE DOCUMENT HERE#4TABLE OF CONTENTS Table of Contents Table of charts, tables and figures_ Presentation 1. International Scenario 10 6 3.1.3. Payment to land owners 3.2. Labor market 3.3. External Sector BOX 1 - "Repetro"- Eligible Products 4. Research, development and innovation 4.1. The RD&I Clause 50 53 53 57 60 61 1.1. Global energy consumption_ 10 1.2. Global production and consumption of oil and natural gas 13 61 1.3. Global oil and natural gas reserves_ 15 4.2. Obligations created by the RD&I clause in Brazil 63 2. Exploration and production of oil in Espírito Santo 19 4.3. Projects and programs developed using the RD&I clause_ 64 42 2.1. Drilling Activity in Espírito Santo_ 19 4.4. Funders and executors of projects financed under the RD&I Clause 67 2.2. Declarations of hydrocarbon traces 21 4.4.1. Main financing and executing companies_ 67 2.3. Declarations of Commerciality_ 22 4.4.2. Main executing institutions 10 70 2.4. Oil and natural gas reserves_ 24 Box 2 - The role of SENAI in the development of innovative projects 72 2.4.1. Offshore reserves in Espírito Santo_ 24 5. Opportunities for Espírito Santo_ 77 2.4.2. Onshore reserves in Espírito Santo_ 26 5.1. Announced investments_ 77 2.5. Total oil and natural gas production_ 28 5.2. Permanent offer 81 2.5.1. Offshore Production in Espírito Santo_ 29 5.3. Petrobras' Divestment Plan 85 2.5.2. Onshore Oil and Gas Production_ 32 5.4. Decommissioning of facilities 88 2.6. Production projection_ 33 Glossary 93 2.6.1. Projection of Offshore Production in Espírito Santo_ 34 Appendices 100 2.6.2. Projection of Onshore Production in Espírito Santo_ 36 Appendix 101 3. Government Share and economic impacts_ 39 3.1. Government Share_ 39 Complementation of the list of the National Classification of Economic Activities (CNAES) of the Oil and Natural Gas industry chain of production 101 3.1.1. Royalties 43 References 103 3.1.2. Special Shares (SS) 47#5TABLE OF CHARTS, TABLES AND FIGURES TABLE OF CHARTS Chart 1 Countries with the highest consumption of primary (in exajoules) - 2020 Chart 2 Participation of fuels in the global energy matrix (in %) Chart 21 Projection of Offshore Oil Production in Espírito Santo (in thousands of barrels) 35 energy 11 Chart 22 Projection of Offshore Natural Gas Production in Espírito Santo (in millions of m³). 36 12 Chart 23 Projection of Onshore Oil Production in Espírito Santo (in thousands of barrels) 38 Chart 3 Production and consumption of oil in the world (thousands of barrels/day) 13 Chart 24 Projection of Onshore Natural Gas Production in Espírito Santo (in millions of m³). 38 Chart 4 Production and consumption of natural gas worldwide (billions of m³). 15 Chart 25 Evolution of the composition of the government share in Brazil, by modality (R$ billions) 40 Chart 5 Proven global oil reserves (billions of barrels) 16 Chart 6 Global natural gas reserves (trillions of m³)_ Chart 7 Global Oil Refining Capacity (thousands of barrels/day). 17 Chart 26 Revenue from the government share (royalties and SS) in Espírito Santo in constant amounts* (R$ million)_ 41 18 Chart 27 Evolution of the average reference price of oil in Espírito Santo (in US$)_42 Chart 8 Onshore and offshore wells drilled in Espírito Santo (in units) 20 Chart 28 Evolution of the average reference price of oil in Espírito Santo (in R$). 42 Chart 9 Quantity of declarations of hydrocarbon traces in Espírito Santo (in units) ___22 Chart 29 Revenues from royalties in Espírito Santo in constant amounts (R$ millions)* 44 Chart 10 Quantity of commerciality declaration in Espírito Santo (in units) 24 Chart 11 Offshore oil reserves (in millions of barrels) 26 Chart 30 Municipalities of the State of Espírito Santo that received more royalties - % of the total royalties received by all municipalities of the State of Espírito 2020 45 Chart 12 Offshore Natural Gas Reserves (millions of m³). 26 Chart 13 Onshore oil reserves (in millions of barrels) 27 Chart 31 Municipalities of Espirito Santo with the highest share in revenues from royalties in their total income (%) -2020 45 Chart 14 Total Onshore Natural Gas Reserves (millions of m³). 27 Chart 32 Revenues from Special Shares in Espírito Santo in constant amounts (R$ million) 49 Chart 15 Total oil production (thousands of barrels)_ 28 Chart 16 Total Natural Gas Production (millions of m³)_ 28 Chart 33 Number of landowners with a share in the production of oil and natural gas in Espírito Santo_ 50 Chart 17 Offshore Oil production by location (thousands of oil barrels) Chart 18 Natural Gas Production by location (thousands of m³). 30 Chart 34 Distribution of formal employees in the chain of production of the O&G industry - Espírito Santo 54 31 Chart 19 Onshore oil production (thousands of oil barrels) 33 Chart 35 Average monthly wage of the links of the chain of production in the O&G industry, 2020 - Espírito Santo and Brazil (R$ thousands) _56 Chart 20 Onshore Natural Gas Production (millions of m³) 33 Chart 36 Exports of oil and share in exports of oil in the total exports of Espírito Santo 58#6TABLE OF CHARTS, TABLES AND FIGURES Chart 37 RD&I Investment Obligations, per annum Chart 38 RD&I Investment Obligations by Oil Company, in billions (2020) Table 4 Formal jobs in the chain of the O&G production sector in Espírito Santo_55 63 _64 Table 5 Characteristics of the jobs market of the O&G chain in Espírito Santo - 2020 56 Chart 39 Number of projects started that received resources under the RD&I clause in Brazil Table 6 Exports of the oil industry in Espírito Santo (US$ FOB millions) 59 65 Chart 40 Projects started that received resources under the RD&I clause in Espírito Santo (number of projects)_ Table 7 Espírito Santo imports of products from the oil industry (US$ FOB millions) _60 66 Chart 41 Quantity of projects started by the funder, in Brazil 68 Table 8 Fields of Operation of the Senai Institute of Technology in Operational Efficiency of Espírito Santo_ 74 Chart 42 Number of projects started by the main executing companies in Brazil 69 Table 9 Main investments announced in the Oil & Gas industry in Espírito Santo for the next 5 years 81 Chart 43 Accredited institutions in Brazil, by State (above 3 institutions)_ _70 S Table 10 Areas offered by Petrobras in Espírito Santo_ 87 Chart 44 Accredited research units in Brazil, by State (10 or more research units___70 Chart 45 Number of projects started according to the main executing institutions, in Brazil Table 11 List of Decommissioning Programs (PDI) of the Espírito Santo Basin, approved and under analysis 90 71 Chart 46 Number of projects initiated/executed with the resources of the RD&I Clause by SENAI, per year Table 12 List of the National Classification of Economic Activities (CNAES) of the oil and natural gas industry chain of production 102 74 Chart 47 Investment in the oil industry worldwide (in billions of US$) 79 TABLE OF FIGURES Chart 48 Distribution of Facility Decommissioning Programs (PDI) approved by ANP, by Basin Figure 1 Main destinations of exportations of crude oil of Espírito Santo in 2020_59 89 Figure 2 Regulatory Time Line of RD&I Projects 63 - Chart 49 Investments Projected for PDI Facilities Decommissioning Programs in Brazil (in millions R$) – 2021-2025 91 Figure 3 Area, theme and sub-theme of the Projects - Espírito Santo 67 LIST OF TABLES Figure 4 Innovation and Technology Institutes that executed projects under the RD&I Clause 77 Table 1 Royalties paid by oil and gas producing fields, onshore and offshore, in Espírito Santo - 2020 Figure 5 Onshore exploratory blocks offered in the Permanent Offer_ 83 45 Figure 6 Offshore exploratory blocks offered in the Permanent Offer 84 Table 2 Special participations paid by fields bordering Espírito Santo 2020* (R$ million) - 47 Figure 7 Areas with marginal accumulations under study for Permanent Offer 85 Table 3 Amounts received in government shares by the State and Municipalities of Espírito Santo (R$ millions)* 52 Figure 8 Inventory of offshore facilities with approved PDI close to the State of Espírito Santo (2021-2026) 93#7CHAPTER 1 | INTERNATIONAL SCENARIO Chapter 1 INTERNATIONAL SCENARIO Society's restlessness with the future mostly consists of dam- ages caused by the increase of the planet's temperature and the consequences of climate change. The main global leaders are negotiating new goals and in- ternational agreements focused on reducing the causes that cause global warming. The energy sector is at the core of these discussions, provided it is responsible for a significant portion of carbon dioxide emis- sions into the atmosphere. The efforts toward reducing emis- sions have led to an energy tran- sition from the current fossil fu- el-intensive energy matrix to a low or zero-carbon emitting one, in the whole planet. In this scenario, the sources of renewable energy became the backbone of the energy transition movement, for meeting the role of generating clean energy. Fossil fuels play a relevant part in pro- viding energy security in the tran- sition period. It is incumbent on large companies in the industry, in their turn, the commitment already assumed by them to intensify the reduction of carbon emissions throughout the value chain. H 1.1 Global energy consumption In 2020, the global consumption of primary energy was 557 exa- joules, 4.3% lower than was re- corded in the previous year. The drop was caused by the retrac- tion of global economic activity caused mostly by the outburst of the new Coronavirus pandemic in March of that year. Global energy consumption is concentrated within a group of ten countries (chart 1) which togeth- er account for 66.9% of the total energy consumed in the world. China and the United States alone represent 41.9% of the total ener- gy consumed worldwide. China's energy matrix is made up of the following sources: coal (56.6%), oil (19.6%), natural gas (8.2%), hydropower (8.1%), renew- able energy (5.4 %), and nuclear energy (2.2%). The energy ma- trix of the United States is com- posed of the following sources: oil (37.1%), natural gas (34.1%), coal (10.5%), nuclear energy (8.4%), re- newable energy (7.0%), and hydro- electric (2.9%). In the last twenty years, the con- sumption of primary energy in the world had an average annual growth of 1.7%. The highlight for the period was the increase in the share of renewable energy sourc- es in the energy matrix. In 2000, renewable sources accounted for 0.7% and in 2020 they rose to an 8.0% share of the total energy consumed in the world (chart 2). The growth in consumption of these sources was present in re- gions with greater participation in the total consumption of primary energy, especially China and the United States. 66.9% of global energy consump- tion is concentrated in a group of ten countries 41.9% of the energy consumed in the world is concentrated in China and the United States 13 13#814 ESPÍRITO SANTO OIL & NATURAL GAS YEARBOOK | 2021 CHAPTER 1 | INTERNATIONAL SCENARIO Chart 1 - Countries with the highest consumption of primary energy (in exajoules) - 2020 145.5 87.7 32.0 28.3 17.0 13.6 12.1 12.0 12.0 11.8 China United Índia Russia Japan Canada Germany Iran Brazil States South Korea Source: BP Statistical Review of World Energy | Prepared by: Ideies/Findes Chart 2 Participation of fuels in the global energy matrix (in %) 0.7% 1.9% 6.7% 5.7% 6.4% 6.5% 5.1% 6.9% 4.3% 25.0% 29.9% 27.2% 21.9% 22.5% 24.7% 15 15 Renewable Energy Hydroelectric Nuclear Energy Coal As renewable sources are still not available on a large scale, the use of natural gas becomes strategic due to the production, flow, treat- ment and regasification infrastructure already installed. Natural gas is less polluting than oil and coal, contributing to the decarbonization of the energy sector. Natural Gas Petroleum 39.1% 34.1% 31.2% 2000 2010 2020 Source: BP Statistical Review of World Energy | Prepared by: Ideies/Findes To a lesser extent, fossil fuels grew more timidly. In 2000, coal repre- sented 25.0% of the total primary energy consumed in the world, and it rose to 27,2% in 2020. Chi- na, India, and the United States concentrated 72.0% of the total coal consumed worldwide. China and the United States reduced the share of this input in the total en- ergy consumption in each country, while India increased the share of coal in the total consumption of primary energy. It is known that coal is one of the most polluting energy sources however, there was no reduction in its consump- tion during the period. Natural gas, which represented 21.9% of the total primary energy consumed in the world in 2000, rose to 24.7% in 2020. Natural gas consumption represents an alter- native in the transition to less pol- luting sources. As renewable sources are still not available on a large scale, the use of natural gas becomes strategic due to the production, flow, treat- ment, and regasification infra- structure already installed. More- over, this source is less polluting than oil and coal, contributing to the decarbonization of the energy sector. The United States, Russia and China concentrated 41.9% of the total consumption of natural gas worldwide. Finally, oil represented 39.1% of primary energy consumption in the world in 2000, decreasing to 31.2% in 2020. In 2020, the United States, China. and India concen- trated 41.5% of the total oil con- sumed worldwide. 1.7% 24.7% 31.2% was the average annual growth in primary energy consumption in the world over the last twenty years of the total primary en- ergy consumed in the world in 2020 came from natural gas of the total primary ener- gy consumed in the world in 2020 came from oil 1.2. Global production and consumption of oil and natural gas World oil production in 2020 was 88.4 million barrels a day, 6.9% lower than in 2019 (chart 3). There was a decrease of 6.6 million bar- rels a day in production, compared to the previous year, which caused the greatest negative variation in the supply of oil in the historical se- ries that began in 1965. The drop was caused by the retraction of global economic activity caused, mainly, by the outbreak of the new Coronavirus pandemic. 2.3 million In 2020, the division of oil produc- tion between regions in the world was: Middle East (31.3%), North America (26.6%), Commonwealth of Independent States (15.3%), Asia (8.4%), Africa (7.8%), South Amer- ica and Central (6.6%) and Europe (4.0%). The top-producing countries were the United States, Saudi Arabia and Russia, which together account- ed for 43.2% of global production. Brazil was the 9th country with the largest production of the input in the world, with 3.0 million barrels a day. barrels of oil per day were consumed in Bra- zil in 2020, which plac- es the country in 8th position in the global ranking Division of oil consumption in the world Asia 38.0% North America 23.5% Europe 14.5% Middle East: 9.4% South and Central America: 6.0% Commonwealth of Independent States (CIS): 4.7% Africa: 4.0% 1. Member States: Armenia, Azerbaijan, Belarus, Kazakhstan, Moldova, Kyrgyzstan, Russia, Tajikistan, Turkmenistan, Ukraine and Uzbekistan#916 Chart 3 - Production and consumption of oil in the world (thousands of barrels/day) 110,000 100,000 90,000 80,000 70,000 60,000 50,000 40,000 30,000 20,000 10,000 Source: BP Statistical Review of World Energy | Prepared by: Ideies/Findes ESPÍRITO SANTO OIL & NATURAL GAS YEARBOOK | 2021 CHAPTER 1 | INTERNATIONAL SCENARIO Production Consumption 2013 2014 2015 2016 2017 2018 2019 2020 Chart 4 Production and consumption of natural gas worldwide (billions of m³) 4,500 4,000 3,500 3,000 2,500 2,000 1,500 1,000 500 0 Production Source: BP Statistical Review of World Energy | Prepared by: Ideies/Findes Consumption 2013 2014 2015 2016 2017 2018 2019 2020 Division of natural gas consumption in the world North America 27.0% Asia Middle Oil consumption follows a distinct dis- tribution of production. In 2020, 88.5 million barrels of oil per day were con- sumed worldwide, 9.3% lower than the volume consumed in the previous year (chart 3). Except for China, all countries registered a drop in oil con- sumption. This country's consump- tion increased by 1.6%, which made China's global share rose from 14.4% to 16.1% between 2019 and 2020. The breakdown of oil consumption among regions in the world was: 32 billion m³ of natural gas per day were consumed in Brazil in 2020, which places the country in 29th place in the global ranking Concerning natural gas, global pro- duction reached 3.9 trillion m³ in 22.5% Asia (38.0%), North America (23.5%), 2020 (chart 4). The production of East 14.4% Commonwealth of Independent States (CIS): 14.1% Middle East: 9.4% Africa: 4.0% South and Central America: 3.8% Europe (14.5%), Middle East (9.4%), South and Central America (6.0%), Commonwealth of Independent States (4.7%) and Africa (4.0%). The countries with the highest consump- tion were the United States, China, and India, which in conjunction ac- count for 40.8% of global consump- tion. Brazil is the 8th country with the highest oil consumption in the world, with 2.3 million barrels a day. this input had a reduction of 122 bil- lion m³ from 2019 to 2020, record- ing the second drop in production in twelve years. The division of natural gas produc- tion among regions in the world was: North America (28.8%), Com- monwealth of Independent States (20.8%), Middle East (17.8%), Asia (16.9%), Africa (6.0%), Europe (5,7%), and South and Central America (4.0%). The top producing countries were the United States, Russia, and Iran, which together account for 46.8% of global pro- duction. Brazil was the 30th coun- try with the largest production of this input in the world, with 24 bil- lion m3 of natural gas. lows a different distribution from production. In 2020, 3.8 trillion m³ of natural gas were consumed worldwide. This amount is 2.1% lower than what was recorded in the previous year. The breakdown of natural gas con- sumption among regions the world was: North America (27.0%), Natural gas consumption also fol- Asia (22.5%), Middle East (14.4%), 1.3. Global oil and natural gas reserves The world's total oil reserves in 2020 were 1.73 trillion barrels of oil, practi- cally stable compared to 2019, with a slight drop of 0.1% (chart 5). In abso- lute terms, the reduction amounted to 2.4 billion barrels. It is worth noting that the last significant change was in 2018 when there was a 37.9 billion barrel increase in global oil reserves. Europe (14.2%), Commonwealth of Independent States (14.1%), Africa (4,0%) and South and Cen- tral America (3.8%). The United States, Russia, and China concen- trated 41.2% of global natural gas consumption. Brazil was the 29th country with the highest consump- tion of this input in the world, with 32 billion m3 of natural gas. 17#1018 Chart 5 Proven global oil reserves (billions of barrels) 2,000 1,750 1,500 1,250 1,000 750 500 250 0 2000 2001 Source: BP Statistical Review of World Energy | Prepared by: Ideies/Findes 2002 2003 2004 2005 2006 2007 2008 2009 2010 2011 2012 2013 2014 2015 ESPÍRITO SANTO OIL & NATURAL GAS YEARBOOK | 2021 CHAPTER 1 | INTERNATIONAL SCENARIO 2016 2017 2018 2019 2020 Chart 6 - Global natural gas reserves (trillions of m³) 200 175 150 125 100 75 50 25 0 2000 2001 2002 2003 2004 Source: BP Statistical Review of World Energy | Prepared by: Ideies/Findes 2009 2010 2011 2012 Division of oil reserves in the world Middle East South and 48.3% The share of oil reserves between regions in the world was: Middle East (48.3%), South and Central America (18.7%), North America (14.0%), Commonwealth of Inde- pendent States (8.4%), Africa (7.2%), Asia (2.6%) and Europe (0.8%). Ven- ezuela, Saudi Arabia and Canada account for 44.4% of the world's to- tal oil reserves. Brazil was the 16th country with the largest reserves of this input in the world, with 11.9 bil- lion barrels of oil. Central 18.7% Regarding natural gas, in 2020, the America North America 14.0% Commonwealth of Independent States (CIS): 8.4% Africa: 7.2% Asia: 2.6% Europe: 0,8% reserves reached 188.1 trillion m³, 1.2% lower than in the previous year. In absolute terms, the drop I was 2.2 trillion m³ of natural gas (chart 6). The distribution of natu- ral gas reserves among regions in the world was: Middle East (40.3%), Commonwealth of Independent States (30.1%), Asia (8.8%), North America (8.1%), Africa (6.9%), South Division of natural gas reserves in the world Middle East 40.3% CIS 30.1% Asia 8.8% North America: 8.1% Africa: 6.9% South and Central America: 4.2% Europe: 1.7% America and Central (4.2%), and Eu- rope (1.7%). Russia, Iran and Qatar account for 50.1% of the world's to- tal natural gas reserves. Brazil was the 33rd country with the largest reserves of this input in the world, with 348.5 billion m³ of natural gas. 11.9 billion 1.4. Global Oil Refining and Capacity The world's refining capacity was 101.9 million barrels a day in 2020. There was an increase of 199 thousand barrels a day, 0.2% more than in the previous year. As for oil refinement, it was 75.5 million bar- rels per day in 2020, representing a 7.4 million barrel drop in refined oil per day in the world, 9.0% lower than the previous year (chart 7). Refining capacity across regions in the world in 2020 was distribut- ed as follows: Asia (35.8%), North America (21.4%), Europe (15.3%), Middle East (10.0%), Common- wealth of Independent States (8.2%), South America and Central (6.1%) and Africa (3.3%). The Unit- ed States, China, and Russia con- centrated 40.8% of the world's oil refining capacity. barrels of oil is the reserve of this input in Brazil in 2020, which places the country in the 16th position. in the global ranking 348.5 billion m³ of natural gas was the reserve of this input in Bra- zil in 2020, which places the country in the 33rd po- sition in the global ranking 19 19#1120 20 ESPÍRITO SANTO OIL & NATURAL GAS YEARBOOK | 2021 CHAPTER 1 | INTERNATIONAL SCENARIO 27 21 2007 2008 2009 2010 2011 2012 2013 2014 2015 2016 2017 2018 2019 2020 Refining Oil refining capacity in the world Asia 35.8% North America 21.4% Europe 15.3% Middle East: 10.0% Commonwealth of Independent States (CIS): 8.2% South and Central America: 6.1% Africa: 3.3% 1.8 million barrels of oil per day were refined in Brazil in 2020, which places the country in the 9th position in the global ranking Brazil was the 9th country with the largest refining capacity in the world, with 2.3 million barrels a day. The United States was the country that most reduced its oil refining capacity in 2020, with a drop in capacity of 831,000 bar- rels of oil per day (4.6% of its to- tal capacity). China, on the other hand, was the country that most increased its oil refining capacity, with an increase of 492 thousand barrels of oil (2.9% of its total ca- pacity). The oil refining share among regions in the world was: Asia (38.0%), North America (21.7%), Europe (14.8%), Middle East (10.1 %), Commonwealth of Indepen- dent States (8.6%), South Amer- ica and Central (4.4%), and Africa (2.4%). The United States, China, and Russia concentrated 44.5% of the world's oil refining. Brazil was the 9th country with the largest oil refining capacity in the world, with 1.8 million barrels a day. Oil refining in the world Chart 7- Global Oil Refining Capacity (thousands of barrels/day) 110,000 100,000 90,000 80,000 70,000 60,000 50,000 40,000 Asia 38.0% 30,000 20,000 10,000 21.7% 0 North America Europe 14.8% Middle East: 10.1% Commonwealth of Independent States (CIS): 8.6% South and Central America: 4.4% Africa: 2.4% 2000 2001 2002 2003 2004 2005 2006 Capacity Source: BP Statistical Review of World Energy | Prepared by: Ideies/Findes#12CHAPTER 2| EXPLORATION AND PRODUCTION OF OIL IN ESPÍRITO SANTO 23 23 Chapter 2 EXPLORATION AND PRODUCTION OF OIL IN ESPÍRITO SANTO The oil and gas exploration and production infrastructure of Espíri- to Santo State, both onshore and offshore, comprises 68 fields in operation and 5 fields in the devel- opment phase. In addition to these, the State has 30 exploratory blocks divided into two sedimentary ba- sins: part of the Campos basin and the entirety of the Espírito Santo ba- sin. On the border with the Campos basin, the State has 7 fields in pro- duction and 2 exploratory blocks. In the Espírito Santo basin, there are 61 fields in production, 7 in the offshore portion and 54 in the on- shore. Still, in this last basin, there are 28 exploratory blocks, 10 in the offshore portion and 18 in the on- shore portion. Twelve (12) oil companies are operating in the State with fields in the production stages or the product development stages. Among them, 4 foreign companies (Central Resources, ONGC Cam- pos, QPI Brasil, and Shell Brasil) and 8 national companies (BGM, Imetame, IPI, Petrobras, Petro- mais, Petrosynergy, Ubunto En- genharia, and Vipetro). Petrobras holds the concession for the fields with the highest productivity in the state, such as the fields that make up Parque das Baleias. 2.1. Drilling Activity in Espírito Santo The offshore drilling activities in Espírito Santo began with the first well on the border with the munici- pality of São Mateus in 1968. Since then, 535 wells have been drilled more frequently between 2009 and 2015, when the annual aver- age of drilling was 37 wells drilled per year. The main oil companies that conducted this process were Petrobras and Shell Brasil. In the most recent period, be- tween 2015 and 2020, offshore drilling was reduced to an annual average of 3 wells drilled, mark- ing the worst performance of the activity since the beginning of offshore drilling in Espírito Santo (chart 8). In 2020, three wells were drilled offshore, two of them in the Campos basin (Campo de Jubar- te and Campo Argonauta) and the other in the Espírito Santo basin (Golfinho). In 2021, until August, three wells were drilled offshore: two wells in Jubarte and one well in block ES-M-669. 562 offshore wells have been drilled in Espírito Santo since 1968 37 was the annual average of offshore well drilling between 2009 and 2014, the period with the highest frequency 6 offshore wells were drilled in 2021, 4 of which in Jubarte, 1 in block ES- M669 and 1 in Argonauta#1324 ESPÍRITO SANTO OIL & NATURAL GAS YEARBOOK | 2021 CHAPTER 2| EXPLORATION AND PRODUCTION OF OIL IN ESPÍRITO SANTO 25 25 Onshore drilling in Espírito San- to began with the drilling of two wells in the city of Conceição da Barra, in 1959. In total, 1,769 wells have been drilled more frequent- ly in the 1980s, when the average drilling was 76 wells per year, and also in the 2000s when the aver- age drilling was 44 wells per year. Between 2016 and 2018, the an- nual average of onshore drilling was reduced to 3 wells, marking it the lowest activity level since the 1970s. However, 2019 and 2020 indicated a possible return of on- shore drilling activity in Espírito Santo (chart 1). Between the two years, 61 wells were drilled by oil companies Petrobras, BGM, and Imetame. Petrobras resumed onshore drilling in the Fazenda Alegre and Cancã fields, while BGM focused its efforts on the Suindara field and Imetame on the Rio Ipiranga field². 1,768 onshore wells have been drilled in Espírito Santo since 1959 76 was the average annual drilling of onshore wells du- ring the 1980s, the period with the highest frequency Chart 8 - Onshore and offshore wells drilled in Espírito Santo (in units) 80 76 74 70 60 50 50 39 R2022 ° 40 30 66 51 7 onshore wells were drilled in 2021, 4 in the Suindara field, 1 in the Rio Ipiranga field, 1 in the ES-T-496 block and 1 47 43 45 40 36 37 38 4240 31 30 30 3232 26 28 27 26 21 18 17 18 18 14 11 10 Onshore Offshore in the ES-T-441 block 30 31 76 3 3 2017 2018 2019 2020 2021 2.2. Declarations of hydrocarbon traces Since 1998, when the declaration of hydrocarbons traces became mandatory, 221 declarations from the offshore origin and 222 decla- rations relative to onshore drilling were issued in Espírito Santo. The first declaration relative to offshore drilling was issued in connection with the BES-100 block (which cov- ers the Golfinho and Canapu fields) and from the Peroá field, both bor- dering the municipalities of Aracruz and Linhares. Between 2018 and 2020, zero off- shore hydrocarbon declarations of hydrocarbon traces were issued in Espírito Santo due to the reduction in exploration activity in the State (chart 2). During this period, Brazil issued 24 offshore declarations of hydrocarbon traces, all concentrat- ed in the Campos, Santos, and Ser- gipe basins. In 2021, the most re- cent period, Petrobras announced the existence of natural gas in block ES-M-669. This block is part of Petrobras and Equinor's cam- paign to reach the pre-salt layer in the Espírito Santo basin³. Onshore, the first declarations of hy- drocarbon traces were issued in the Mosquito and Fazenda Alegre fields, located in the municipalities of São Mateus and Jaguaré. The highest frequency of issuance occurred between 2005 and 2013 when the annual average issuance was 17 declarations per year. The main oil companies that conducted this pro- cess were Petrobras and Vipetro. Between 2016 and 2018, no onshore declarations of hydrocarbon traces were issued in Espírito Santo due to the reduction of exploration activity in the state (chart 9). In this period, Brazil issued 41 onshore declara- tions of hydrocarbon traces, all con- centrated in the basins of Potiguar, Recôncavo5, and Parnaíba. Between 2019 and 2020, 4 dec- larations of hydrocarbon traces were issued on the Espírito Santo for onshore drilling. Imetame an- nounced the discovery of oil and natural gas in block ES-T-487 and BGM announced the discovery of oil in three wells in the Suinda- ra field. In 2021, the most recent period, Imetame announced the existence of Oil in block ES-T-441, located in the municipality of Jag- uaré. This block was acquired in the 14th round of the ANP auction held in 2017. 221 223 offshore de- clarations of hydrocarbon traces onshore de- clarations of hydrocarbon traces This was the number of declarations issued in Espírito Santo since 1998 2021 Petrobras announced the existence of natural gas in block ES-M-669 Imetame announced the existence of oil in block ES-T-441 (municipality of Jaguaré) 2022 BGM announced the existence of oil in block ES-T-496 2. Of the total 61 wells drilled onshore between 2019 and 2020, 30 are currently producing, which represents a 49.2% success rate 3. The project, entitled "Prospector de Monai" will be essential for them to be able to assess the exploration of other concessions acquired in the 11th round of the ANP auction, which, so far, has not presented areas of interest for exploration. 4. Located in the State of Rio Grande do Norte and Ceará. 5. Located in the State of Bahia. 6. Located in the States of Piauí, Maranhão, Pará, Tocantins, Bahia and Ceará. Source: ANP | Prepared by: Ideies/Findes#1430 26 Chart 9 Quantity of declarations of hydrocarbon traces in Espírito Santo (in units) ESPÍRITO SANTO OIL & NATURAL GAS YEARBOOK | 2021 26 25 25 22 21 20 20 15 25 19 18 18 17 17 16 14. 14 14 13 11 10 10 10 8 00 8 6 5 0 Source: ANP | Prepared by: Ideies/Findes 14 1211 11 Onshore Offshore 2014 2015 2016 0 0 2 2017- 2018 2019 3 2020 2021 10 9 028 16 5 4 3 2-0 1 CHAPTER 2| EXPLORATION AND PRODUCTION OF OIL IN ESPÍRITO SANTO Chart 10 Quantity of commerciality declaration in Espírito Santo (in units) 5 8 8 8 3 2 2 1 00 0 0 0 Source: ANP | Prepared by: Ideies/Findes Onshore 1 1 1 00 00 00 00 2011 2012 2013 2014 2015 2016 Offshore 2017 3 2018 2019 2020 2021 20 tions of commer- ciality onshore declara- 37 tions of commer- ciality This was the number of declarations issued in Espírito Santo since 1998 2.3. Declarations of Commerciality Since 1999, 50 declarations of com- merciality have been issued in Es- offshore declara- pírito Santo, 37 for onshore and 20 for offshore exploration. The first offshore declaration was issued in the Jubarte and Cachalote fields, in 2002. The highest frequency of is- suance of declarations for offshore production occurred in the period between 2002 and 2006, with an an- nual average of 4 declarations (chart 10). The oil companies responsible were Petrobras and Shell Brasil. In December 2021, the ANP approved the declaration of commerciality for the Wahoo field, at the request of PetroRio. The Wahoo field is locat- ed in the pre-salt layer, in the Espíri- to Santo part of the Campos Basin. Since 2008, Espírito Santo has not registered a declaration of commer- ciality at sea. The last one was is- sued at the request of Petrobras for the Camarupim Norte field. 2020 3 onshore declarations were issued in the Suinda- ra, Rio Mariricu and Garça Branca fields. 2021 offshore declarations of commerciality were issued for the Wahoo field. The first declaration on onshore wells was issued in 2002, in the Mosquito field, located in the municipality of São Mateus. The highest frequency of onshore dec- larations of commerciality issued occurred between 2007 and 2010, with an annual average of 7 dec- larations (chart 10). Petrobras was the main oil company responsible for issuing these declarations. In 2018, Petrobras issued a declara- tion of commerciality for the Can- cã Leste field, and in the following year, no onshore declaration was issued in the State. In 2020, 3 dec- larations were issued for the fields of Suindara, Rio Mariricu, and Garça Branca. The oil companies responsible for issuing relative to these fields were, respectively, BGM, Petrobras, and Petromais. In more recent times, the low number of issuance of declara- tions of commerciality in Espírito Santo signals a low number of 2.4. Oil and natural gas reserves In 2020, Brazilian oil reserves reached 20.2 billion barrels, 7.2% lower than in 2019. Espírito Santo reached, in 2020, an oil reserve of 1.3 billion barrels of oil, 5.6% lower than what was recorded in the pre- vious year. With this drop, the State becomes the third largest holder of oil reserves in the country, after São Paulo (2.1 billion barrels) and Rio de Janeiro (16.0 billion barrels). new oil and natural gas explora- tion and production projects in the State. As for natural gas, in 2020 Brazil- ian reserves reached 450.9 billion m³, 17.9% lower than in 2019. In Espírito Santo, the total reserves reached 30.7 billion m3, 36.2% low- er than in the previous year. With this decrease, the State became the third largest holder of natu- ral gas reserves, after São Paulo (37.7 billion m³) and Rio de Janeiro (281.4 billion m³). 1.3 billion barrels of oil is the reserve of this input in Espírito San- to in 2020, which places the state in the 3rd position in the national ranking 30.7 billion m³ of natural gas is the re- serve of this input in Espírito Santo, which places the state in the 3rd position in the national ranking 1 27 27#1528 ESPÍRITO SANTO OIL & NATURAL GAS YEARBOOK | 2021 CHAPTER 2| EXPLORATION AND PRODUCTION OF OIL IN ESPÍRITO SANTO 29 29 8.1% was the drop in offshore oil reserves in Espírito Santo in 2020 36.7% was the drop in offshore natural gas reserves in Espírito Santo in 2020 2.4.1. Offshore reserves in Espírito Santo In 2020, Espírito Santo's offshore oil reserves fell by 8.1% compared to the previous year, reaching 1.2 billion barrels of oil (chart 11). Upon the decrease, the State recorded the lowest level of offshore oil re- serves in 17 years, thus losing its position as the second State with the highest volume of offshore oil reserves. The state of São Paulo, by recording a 123.4% increase in the same comparison, takes over the second position, only behind the State of Rio de Janeiro. Regarding offshore Natural Gas, in 2020, Espírito Santo reached 30.2 billion m3 of reserves, a 36.7% de- crease compared to the previous year (chart 12). Due to that de- crease, the State lost its position as Chart 12 Offshore Natural Gas Reserves (millions of m³) 110,000 70,000 the second State with the highest volume of offshore natural gas re- serves. The state of São Paulo, by recording a 19.2% increase in the same comparison, takes over the second position, only behind the State of Rio de Janeiro. 100,000 90,000 80,000 60,000 50,000 40,000 30,000 20,000 10,000 The indicator that assesses the useful life of reserves that will sustain production over time showed that, currently, Espírito Santo has offshore oil reserves with a useful life estimated at 14 years, below the average Brazilian indicator that recorded 19 years. Concerning natural gas, the indi- cator showed that Espírito Santo reserves have a useful life of 13. years, higher than the national in- dicator, which recorded 9 years. Chart 11 - Offshore oil reserves (in millions of barrels) 3,000 2,750 2,500 2,250 1,000 The useful life of offshore 1,750 oil reserves in Espírito 1,500 Santo is 14 years, below 1,250 the national average 1,000 750 set at 19 years. 500 250 2000 2002 2004 2006 2008 2010 2012 2014 2016 2018 2020 The useful life of offshore natural gas reserves in Espírito Santo is 13 years, above the national average set at 9 years. Source: ANP | Prepared by: Ideies/Findes 2000 2002 2004 2007 2009 2011 2013 2015 2017 2019 2020 61.7% was the increase in onshore oil reserves in Espírito Santo in 2020 70.1% was the increase in onshore natural gas reserves in Espírito Santo in 2020 Source: ANP | Prepared by: Ideies/Findes L 2.4.2. Onshore reserves in Espírito Santo Regarding the onshore scenario, in 2020, oil reserves in Espírito San- to increased by 61.7% compared to the previous year, reaching 79.7 million barrels of oil (chart 13). With this increase, the state reaches the highest level of onshore oil re- serves in 10 years and maintains its position as the fourth state with the largest onshore reserves among all Brazilian states, behind Sergipe (172.8 million barrels), Rio Grande do Norte (176.8 million barrels) and Bahia (204.0 million barrels). Onshore natural gas reserves in- creased by 70.1% in 2020 compared to the previous year and reached a reserve of 386.0 million m³ (Chart 14), raking Espírito Santo in sixth place among the states with the largest reserves of the resource. The states of Amazonas (47.7 mil- lion m³), Maranhão (29.1 million m³), Bahia (8.9 million m³), Alagoas (2.6 million m³) and Rio Grande do Norte (1,9 million m³), respectively, are among the largest onshore nat- ural gas reserves. The indicator that calculates the useful life of reserves that will sus- tain production over time showed that, currently, Espírito Santo has a useful life of onshore oil reserves of 24 years, above the Brazilian average indicator that recorded 20 years. Furthermore, the indicator for natural gas showed that Espíri- to Santo reserves have a useful life of 14 years, higher than the aver- age national indicator, which re- corded 12 years. The useful life of onshore oil reserves in Espírito Santo is 24 years, above the national average of 20 years The useful life of onshore natural gas reserves in Espírito Santo is 14 years, above the national average of 12 years 7. The indicator is calculated through the ratio be- tween the reserve and the production of oil and natural gas. The higher the indicator, the longer the time available for producing these input. 8. The indicator is calculated through the ratio between the reserve and the production of oil and natural gas. The higher the indicator, the longer the time available#1630 30 ESPÍRITO SANTO OIL & NATURAL GAS YEARBOOK | 2021 CHAPTER 2| EXPLORATION AND PRODUCTION OF OIL IN ESPÍRITO SANTO The increase in oil and natural gas reserves onshore in Espírito Santo signals the recovery of this activity in Espírito Santo. This movement is mainly explained by the regulatory incentives promoted by the ANP, which stimulated the opening of the sector by promoting competi- tion and attracting small and me- dium-sized companies to onshore production. Chart 13-Onshore oil reserves (in millions of barrels) 300 250 200 88 150- 100- 50- ul............ 2000 2001 2002 2003 2004 2005 2006 2007 2008 2009 2010 2011 2012 2013 2014 2015 2016 2017 2018 2019 2020 Source: ANP | Prepared by: Ideies/Findes 2.3 million Between 2011 and 2018, the state remained the second largest pro- ducer of the input, losing in 2019 to the state of São Paulo. Concerning natural gas, in 2020 Brazilian production was 46.6 mil- lion m3, 4.3% lower than what had been recorded in 2019. In Espírito m³ of natural gas were produced in Espírito Santo in 2020, which places the state in the 4th position in the national ranking Santo, 2.3 million m³ were pro- duced, 13.8% lower than in the pre- vious year (chart 16). The state re- mained the fourth largest producer of natural gas among all States, behind Amazonas (5.0 million m³), São Paulo (6.2 million m³), and Rio de Janeiro (29.6 million m³). m³). Chart 15 - Total oil production (thousands of barrels) The increase in oil and natural gas reserves onshore Espírito Santo signals the recovery of this activity in Espírito Santo. This movement is mainly explained by the regulatory incen- tives promoted by the ANP, which stimulated the opening of the sector by promoting competition and at- tracting small and me- dium-sized companies to onshore production. Chart 14 Total Onshore Natural Gas Reserves (millions of m³) 3,500 3,000 2,500- 2,000 1,500 1,000 500 lulu 150,000 125,000 100,000 75,000 50,000 25,000 T T T T T T T T T 2000 2001 2002 2003 2004 2005 2006 2007 2008 2009 2010 2011 2012 2013 2014 2015 2016 2017 2018 2019 2020 Onshore Offshore 2000 2001 2002 2003 2004 2005 2006 2007 2008 2009 2010 2011 2012 2013 2014 2015 2016 2017 2018 2019 2020 Source: ANP | Prepared by: Ideies/Findes Source: ANP | Prepared by: Ideies/Findes 90.4 million barrels of oil were pro- duced in Espírito Santo in 2020, which places the state in the 3rd position in the national ranking 2.5. Total oil and natural gas production Brazilian oil production reached 1.1 billion barrels in 2020, 5.7% higher than in 2019. Espírito Santo produced, in 2020, a total of 90.4 million barrels of oil, 13.9% lower than what had been recorded in the previous year (Chart 15). The State remained in the third posi- tion with the highest oil production among all States, only behind São Paulo (98.2 million barrels) and Rio de Janeiro (853.8 million barrels). Chart 16 Total Natural Gas Production (millions of m³) 5,000- 4,500 4,000- 3,500- 3,000- 2,500- 2,000- 1,500- 1,000 500- T 2000 2001 2002 2003 2004 2005 2006 2007 2008 2009 2010 2011 2012 2013 2014 2015 2016 2017 2018 2019 2020 Onshore Offshore Source: ANP | Prepared by: Ideies/Findes 7 31#1732 ESPÍRITO SANTO OIL & NATURAL GAS YEARBOOK | 2021 CHAPTER 2| EXPLORATION AND PRODUCTION OF OIL IN ESPÍRITO SANTO 2.5.1. Offshore Production in Espírito Santo The offshore oil production in Espírito Santo in 2020 was 87.1 million barrels, 14.2% lower than the volume recorded in the pre- vious year (Chart 17). With this drop, the state is approaching the levels produced in 2010, the year when production from the pre-salt layer of Espírito Santo waters began. The drop can be explained mainly by the perfor- mance of the production of pre- salt layer wells, which, in 2020, dropped by 19.7%, reaching a production equal to 234 million barrels of oil. Production in the pre-salt layer is responsible for 51.7% of the total oil produced offshore in Espírito Santo. Regarding the division by loca- tion, Espírito Santo's offshore production can be divided into three parts. The first two are located in the Campos Basin, in the producing fields of Parque das Baleias and of Parque das Conchas, and the third one is lo- cated in the producing fields of the Espírito Santo Basin. Offshore oil production is con- centrated in Parque das Baleias and Parque das Conchas, oper- ated by Petrobras and Shell Bra- sil, respectively. The production of natural gas associated with oil is concentrated in Parque das Baleias and the production of natural gas not associated with oil is concentrated in the produc- ing fields of the Espírito Santo Basin, mostly operated by Petro- bras and in the process of being sold by the company. duced in 2019, responsible for 4.3% of oil production in Espírito Santo in 2020. It must be noted that offshore oil-producing regions, part of the Campos Basin and the Espírito Santo Basin are in the natural phase of declining production and, consequently, they have shown a decline in production. Regarding offshore natural gas in Espírito Santo, Parque das Bale- ias produced, in 2020, 1.8 billion m³ of the input, 17.4% lower than the previous year. Parque das Conchas produced, in the same period of comparison, a total of 157.5 million m³ of natural gas, a 24.6% increase relative to pro- duction in the previous year. The fields in the Espírito Santo basin produced a total of 275.5 million m³ of natural gas, 1.6% less than the previous year. Natural gas production in Parque das Baleias and the offshore fields in the Espírito Santo Basin represented 80.0% and 12.0% of Espírito Santo's total natural gas production, respectively. The pro- duction of natural gas in Parque das Conchas represented, in the same period used for compari- son, 6.8% of the total production of natural gas in Espírito Santo. Both offshore oil-pro- ducing regions, part of the Campos Ba- sin and the Espírito Santo Basin are in the natural phase of declining production and, consequently, they have shown a decline in production in recent years. 87.1 million barrels of offshore oil were produced in Espírito Santo in 2020 2.3 billion m³ of offshore natural gas were produced in Espírito Santo in 2020 In 2020, oil production at Parque das Baleias fell by 18.9% com- pared to the same period in the previous year, producing 68.7 million barrels of oil that year, but still accounting for 78.9% of the total oil produced in the state. In 2020, Parque das Con- chas produced a total of 14.6 million barrels of oil, a 10.8% With a drop of 14.2% in 2020, oil production in Espírito Santo approaches the level produced in 2010. Chart 17-Offshore Oil production by location (thousands of oil barrels) drop compared to the previous year, concentrating 16.8% of to- tal local oil production. The only oil-producing field in the offshore producing fields of the Espírito Santo Basin is the Golfin- ho field which, in 2020, produced a total of 3.7 million barrels of oil, 7.3% higher than the level pro- 160,000 140,000 120,000 100,000 80,000 60,000 40,000 20,000 0 2009 2010 2011 2012 Parque das Baleias 2013 2014 2015 2016 Parque das Conchas Source: ANP | Prepared by: Ideies/Findes 9. In 2019, ANP and Petrobras signed an agreement concerning the Parque das Baleias reservoir for the purpose of paying royalties and special participations. The agreement considered only one reservoir called Novo Campo de Jubarte, which included the areas between Jubarte, Baleia Azul, Baleia Franca, parts of Cachalote, Mangangá, and Pirambu. The agreement made it possible to ap- prove a new Development Plan for Novo Campo de Jubarte, with an extension for another 27 years for the production phase. 2017 2018 2019 2020 Campos in the Espirito Santo Basin 10. Comprised by the Abalone, Argonauta, and Ostra fields. 11. Comprised by Cação, Camarupim, Camarupim Norte, Canapu, Cangoá, Golfinho, and Peroá fields. 33#1834 ESPÍRITO SANTO OIL & NATURAL GAS YEARBOOK | 2021 CHAPTER 2| EXPLORATION AND PRODUCTION OF OIL IN ESPÍRITO SANTO Chart 18 Natural Gas Production by location (thousands of m³) 5,000 4,500 4,000 3,600 3,000 2,500 2,000 1,500 1,000 500 0 2010 2011 2012 2013 2014 2015 2016 2017 Parque das Baleias Campos in the Espirito Santo Basin 2018 2019 Parque das Conchas 2020 Source: ANP | Prepared by: Ideies/Findes 3.3 million barrels of onshore oil were produced in Espírito Santo in 2020 27.0 million m³ of onshore natural gas were produced in Espírito. Santo in 2020 2.5.2. Onshore Oil and Gas Production Offshore oil production in Espírito Santo in 2020 was 3.3 million barrels, 6.2% lower than the volume recorded in the previous year (Chart 19). The State has reached the lowest level of onshore oil production since the be- ginning of the century. The Produc- tion historic peak was between 2002 and 2003 when 9.0 and 9.2 million barrels, respectively. After this peri- od, production reduced, attaining in 2020 the same production levels of the 1990s, when the exploratory ac- tivities of the 2000s had not yet been intensified. Onshore natural gas production in Espírito Santo, in 2020, was 27.0 mil- lion m³, 15.7% lower than in the pre- Ivious year (chart 20). The State has reached the lowest level of onshore natural gas production since the be- reached its historic peak between 2004 and 2005 when 473.7 and 474.0 million m³ of natural gas, re- spectively. The explanation for this trend is re- lated to Petrobras' little desire for onshore production, and the little stimulus provided by ANP through regulatory measures during the ear- ly 2000s. Despite these results, it is expected that Espírito Santo's on- 95.0% of onshore oil pro- duction in Espírito Santo is concentrated in ten fields: 95.0% of onshore oil production in Espírito Santo is concentrated in ten producing fields: Fazenda Alegre (48.6%), Cancã (15.8%), In- hambu (8.0%), Fazenda São Ra- fael (7.7%), Fazenda Santa Luzia (6.8%), Fazenda São Jorge (3.2%), Rio Preto Oeste (1.5%), São Mateus (1.2%), Fazenda Queimadas (1.1%), and Lagoa Parda (1.1%). Except for 48.6% the Lagoa Parda field under con- Fazenda Alegre Cancã 15.8% Inhambu 8.0% Fazenda São Rafael: 7.7% Fazenda Santa Luzia: 6.8% Fazenda São Jorge: 3.2% Rio Preto Oeste: 1.5% São Mateus: 1.2% Fazenda Queimadas: 1.1% Lagoa Parda: 1.1% cession to the Imetame group, all other fields were granted under concession to Petrobras. Onshore natural gas production in Espírito Santo is concentrated in ten producing fields, which, in conjunc- tion account for 96.2% of total pro- duction. These fields are: Fazenda Alegre (39.9%), Fazenda Santa Luzia (18.3%), Fazenda São Rafael (17.3%), Cancã (6.4%), Rio São Mateus (6.0%), Lagoa Parda (2.0%), Fazenda São Jorge (2.0%), Inhambu (1.7%), Cacim- bas (1.4%) and Lagoa Suruaca (1.1%). Chart 19 Onshore oil production (thousands of oil barrels) 10,000 9,000 8,000 shore production may show signs of recovery due to the recent measures implemented by ANP to encourage onshore production, especially and more intensively after 2017. More- over, the sale of onshore assets by Petrobras could attract new players in the sector and, thereby boost fu- ture production. 7,000 6,000 5,000 4,000 3,000 2,000 1,000 ginning of the century. Production Regarding the division by location, 96.2% of onshore natural gas production in Espírito Santo is concentrated in ten fields: Fazenda Alegre 39.9% Fazenda Santa Luzia 18.3% 17.3% Fazenda São Rafael Cancã: 6.4% Rio São Mateus: 6.0% Lagoa Parda: 2.0% Fazenda São Jorge: 2.0% Inhambu: 1.7% Cacimbas: 1.4% Lagoa Suruaca: 1.1% Chart 20-Onshore Natural Gas Production (millions of m³) 500 450 400 350 300 250 200 150 100 50 2000 2002 2004 2006 2008 2010 2012 2014 2016 2018 2020 Source: ANP | Prepared by: Ideies/Findes 2000 2002 2004 2006 2008 2010 2012 2014 2016 2018 2020 Note 1: the evolution of production by producing field can be found in the appendix of this document 55 35#1936 ESPÍRITO SANTO OIL & NATURAL GAS YEARBOOK | 2021 CHAPTER 2 EXPLORATION AND PRODUCTION OF OIL IN ESPÍRITO SANTO 37 2.6. Production projection For the projection of oil and na- tural gas production in Espírito Santo, the use of accounting ru- les was adopted as a methodo- logy to capture the production trend focused on the regional supply of the input. The values operator, and platform. More in- were projected until 2025 consi- formation about the methodolo- dering a detailed analysis of the gy can be obtained at portaldain- hydrocarbon supply profile and in dustria-es.com.br/categorias/ connection to the exploration and notas-tecnicas/arquivos. production phases of each field, 2.6.1. Projection of Offshore Production in Espírito Santo Offshore production represents the majority portion of the total oil and natural gas volumes produced in Espírito Santo. The evolution of offshore extraction determines the total volume produced in the state and, for the next years, it is expect- ed that this configuration will re- main the same. It is expected that by 2025 offshore oil production will have an average annual decline of 2.7%, reaching a production of 64.4 million barrels. For natural gas, an average annual increase of 1.02% is projected until 2025, reaching a production of 2.1 billion m3. Charts 21 and 22 present the re- cent evolution and the projection of offshore production until 2025. The downward trend in input pro- duction can be explained by the natural decline of offshore produc- ing fields (Appendix I), especially in Parque das Baleias and Parque das Conchas, which concentrate the State's offshore oil and gas pro- duction. Furthermore, there is the fact that the last communication of offshore commerciality took place in 2008 and that there was no of fer of offshore oil fields in the last traditional auction rounds. This scenario signals a low number of new offshore projects in the State and the consequent concentration of future production in projects that were developed in the past. 2.7% is the expected average annual drop through 2025 in offshore oil production, reaching 64.4 million barrels 1.0% is the average annual increase expected until 2025 in offshore natural gas production, reaching 2.1 billion m³ The downward trend in oil production can be explained by the natural decline of offshore producing fields, especially in Parque das Baleias and Parque das Conchas With the new platform at Parque das Baleias, an increase is projected for 2025, of: 52.2% in oil production 65.6% in natural gas production For the years between 2021 and 2023, less accentuated drops are projected due to better use of the production in Parque das Conchas and the temporary non-interruption of the State's offshore fields due to low prices, an episode witnessed in 2020 due to the Covid-19 health crisis. Moreover, it is expected that the new operator of Polo de Peroá will invest in the revitalization of the area and thus increase the reserve recovery factor, which is likely to in- crease natural gas production. A significant change was consid- ered between 2024 and 2025 when Petrobras intends to startup a new platform at Parque das Baleias. The project provides for the unification of the Novo Campo de Jubarte, formed by the Jubarte, Baleia Azul, Baleia Franca areas, parts of Cach- alote and Pirambu. Upon imple- mentation of the project, a 52.2% in- crease in oil production and 65.6% in natural gas production is projected for 2025 compared to 2024. Chart 21 Projection of Offshore Oil Production in Espírito Santo (in thousands of barrels) 139,490 133,869 118,721 101,517 87,144 73,891 64,781 64,443 56,589 51,836 2,218 49,617 42,353 22,090 2016 2017 2018 2019 Production Projected 2020 Prepared by: Ideies and LCA 2021 2022 (p) 2023 (p) 2024 (p) 2025 (p) Parque das Baleias New Plataform Chart 22 - Projection of Offshore Natural Gas Production in Espírito Santo (in millions of m³) 3,815 3,959 3,432 2,640 2,277 2,074 1,971 1,752 1,570 1,478 72 821 1,406 1,253 2016 2017 2018 Production 2019 2020 Projected 2021 2022 (p) 2023 (p) 2024 (p) 2025 (p) Parque das Baleias New Plataform Prepared by: Ideies and LCA#2038 ESPÍRITO SANTO OIL & NATURAL GAS YEARBOOK | 2021 CHAPTER 2 EXPLORATION AND PRODUCTION OF OIL IN ESPÍRITO SANTO 39 2.6.2. Projection of Onshore Production in Espírito Santo Onshore production is responsible for the minority portion of the pro- duced oil and natural gas volume. The evolution of onshore production does not significantly affect the total produced by the State. However, this activity is important in the regional socioeconomic development of the producing municipalities, particularly in the creation of jobs and income. By 2025, onshore oil production is expected to experience an average annual decline of 3.58%, reaching in 2025 a production of 2.5 million barrels. For natural gas, an average annual drop of 3.62% is projected by 2025, reaching a production volume of 21.7 million m³. Charts 23 and 24 present the recent evolution and projection of onshore production for 2025. The downward trend in input production is because all the main fields are mature and in a downward production trend (Ap- pendix II). Moreover, Petrobras has no interest in developing onshore assets, which reduces the capacity to absorb new projects in the region. Onshore natural gas production does not necessarily follow oil production. Consequently, the concentration in oil production areas differs from the concentration of natural gas. In terms of oil production, the Fazen- da Alegre, Cancã, Inhambu and Fa- zenda São Rafael fields account for 78.9% of total onshore production. In terms of natural gas production, the Fazenda Alegre, Fazenda São Rafael, Fazenda Santa Luzia and Rio São Mateus fields account for 80.2% of the total onshore production. The natural downward trend in produc- tion in these fields explains the recent and future evolution of onshore pro- duction in the state. After 2022, the drops in production are likely to be less intensive due to the temporary non-interruption of production caused by low prices, an episode witnessed in 2020 related to the Covid-19 health crisis. Further- more, the sale of Petrobras assets to other operators could start a process of revitalization and extension of the useful life of onshore reserves, which should improve future production. It is also worth noting that there are new onshore projects in Espírito San- to which have still not been disclosed by the new companies operating in the region, as a result of the diversifi- cation of operators promoted by the ANP and due to the sale of Petrobras assets. As onshore production values are lower, any new projects or unconsid- ered interruptions can cause large deviations from projected volumes. 3.58% is the expected average annual decline through 2025 in annual onshore oil production, reaching 2.5 million barrels 3.62% is the average annual drop expected by 2025 in an- nual onshore natural gas production, reaching 21.7 million m3 The downward trend in input production is due to the fact that all the main fields are mature and with a tendency to present a decline in production. Chart 23 - Projection of Onshore Oil Production in Espírito Santo (in thousands of barrels) 4,690 3,891 3,588 3,472 3,256 2,989 2,818 2,710 2,612 2,491 2016 2017 2018 2019 2020 Production 2021 2022 (p) 2023 (p) 2024 (p) 2025 (p) Projected Prepared by: Ideies and LCA Chart 24-Projection of Onshore Natural Gas Production in Espírito Santo (in millions of m³) 80 62.9 31.1 32.0 27.0 26.1 24.6 23.7 22.8 21.7 2016 2017 2018 2019 2020 Production Prepared by: Ideies and LCA 2021 2022 (p) 2023 (p) 2024 (p) 2025 (p) Projected#21CHAPTER 3 GOVERNMENT SHARE AND ECONOMIC IMPACTS 41 47 Chapter 3 GOVERNMENT SHARE AND ECONOMIC IMPACTS 愛 The exploration and production of oil and natural gas generate de- mands for goods and services that create a specialized market around them. The consequences are an expansion in the number of compa- nies, qualified jobs, investments and payment of financial compensation, and taxes relative to the exploration of this natural resource. R$ 47.0 billion were paid for oil and natu- ral gas production in Brazil in connection with the government share in 2020 The composition of payments made to the Federal Government, States, and Municipalities was as follows Special 50.8% shares Royalties 48.5% Occupancy 0.6% rate Signing 0.03% Bonus 3.1. Government Share The oil companies bidding in oil and natural gas fields 12 pay finan- cial compensation for exploring a finite natural resource owned by the country 13 referred to as gov- ernment share. In 2020, the production of oil and natural gas in Brazil paid R$ 47.0 billion to the Government Share, an amount allocated to the Feder- al Government States and munic- ipalities. The breakdown of these pay- ments in the country was: 50.8% in special shares (SS); 48.5% in royalties; 0.6% in area occupa- tion or retention fee; and 0.03% in signing bonuses 14. We point out that only the first two are also redirected to State governments and municipalities. In 2020, the amount paid in the government share in Brazil was reduced by 64.4%, compared by the same period in the previ- ous year. This drop was mainly caused by the lower generation of signing bonuses (-99.9%), the amount disbursed by the compa- nies that won the bidding, due to the postponement of ANP auc- tions caused by the Covid-19 pan- demic. Furthermore, there were also reductions in revenues rom government share (-29.7%) and royalties (-6.8%) in the country Overall, Espírito Santo received R$ 2.3 billion in Government Shares in 2020, which corresponded to 5.0% of the total amount in the country. It was the third larg- est share collection among the states, only behind Rio de Janei- ro (R$ 18.7 billion) and São Paulo (R$ 2.5 billion). Of that total, 53.8% was allocated to the Government of Espírito Santo and 46.2% to the municipalities. 12. Companies that win the bidding rounds held by ANP (Law 9.478/1997). 13. Art. 20 of the Federal Constitution. 14. The signing bonus is a government share only destined for the Federal Government.#2242 42 ESPÍRITO SANTO OIL & NATURAL GAS YEARBOOK | 2021 CHAPTER 3 GOVERNMENT SHARE AND ECONOMIC IMPACTS 43 43 Ranking of amounts received in Government Shares 1st: Rio de Janeiro R$ 18.7 billion was received by Rio de Ja- neiro in Government Shares 2nd: São Paulo R$ 2.5 billion was received by São Paulo in Government Shares 3rd: Espírito Santo R$ 2.3 billion was received by Espírito Santo in Government Shares Chart 25 Evolution of the composition of the government share in Brazil, by modality (R$ billions) Compared to 2019, the amount re- ceived from Government Share by Espírito Santo decreased by 43,9% in 2020. And the drop in revenue in the state government (-47.1%) was greater than that of the municipali- ties of Espírito Santo (-36.5%). The main contributing factor to the loss of revenue from the gov- ernment share in Espírito Santo is caused by the drop in special shares received (-53.1%). It is worth noting that 2019 recorded an atypi- cal flow of Special Shares received due to the signing of the agreement to unify Parque das Baleias, which caused the basis for comparison to be higher. Not only that but roy- alties (-27.2%) also declined in the State at the turn of the year. Furthermore, in 2020, the drop in oil and natural gas production and the devaluation of the price of the barrel - provided that the latter is explained Chart 27 Evolution of the average reference price of oil in Espírito Santo (in US$) by the reduction in world demand due to the Covid-19 pandemic - also contributed to the reduction in the revenue from the Government Share both in the state and country. On the other hand, the devaluation of the Brazilian currency (Real) exchange rate against the dollar was a coun- terpoint to this result, which can be seen by the difference in the magni- tude of the reduction in the average reference price of Espírito Santo in Reais and US Dollars (chart 27). (R$ bilions) 140 120 131.9 20% 18% 16% 100 80 14% 77.7 12% 60 48.9 37.9 40 72.1 48.7 34.7 30.8 20.7 10% 8% 47.0 6% 4% 20 2% 0 0% 2010 2011 2012 2013 2012 2015 2016 2017 2018 2019 2020 ES participation in BR (Royalties and PE) Royalties Special Shares Ocupation or area fee Signing Bonuses $103.28 $95.88 $97.51 $98.72 $62.67 $55.22 $50.20 $43.57 $37.10 $31.69 2011 2012 2013 2014 2015 2016 2017 2018 2019 2020 Total government shares Share of ES (Royalties and PE) (*) Amounts with deflation calculated according to the IPCA index (accumulated from Jan-Dec 2020). Source: ANP | Prepared by: Ideies/Findes Share transferred to ES in BR (Royalties and PE) Chart 26 Revenue from the government share (royalties and SS) in Espírito Santo in constant amounts* (R$ million) Source: ANP | Prepared by: Ideies/Findes Chart 28 Evolution of the average reference price of oil in Espírito Santo (in R$) 4,500 4,000 3,500 3,000 2,500 2,000 1,500 1,000 500 0 2001 2002 2003 2004 2005 2006 2007 2008 2009 2010 2011 2012 2013 2014 2015 2016 2017 2018 2019 2020 Municipality of ES State of ES (*) Amounts with deflation calculated according to the IPCA index (accumulated from Jan-Dec 2020). Source: ANP | Prepared by: Ideies/Findes R$ 227.8 R$ 206.3 R$ 197.3 R$ 158.4 R$ 156.9 R$ 139.6 R$ 113.1 R$ 223.1 R$ 215.1 R$ 184.2 2011 2012 2013 2014 2015 2016 2017 2018 2019 2020 Source: ANP | Prepared by: Ideies/Findes#2344 3.1.1. Royalties ESPÍRITO SANTO OIL & NATURAL GAS YEARBOOK | 2021 CHAPTER 3 GOVERNMENT SHARE AND ECONOMIC IMPACTS Ranking of amounts received in Government Shares 1st: Rio de Janeiro R$9.9 billion were received by Rio de Janeiro in royalties in 2020 2nd: São Paulo R$ 1.7 billion was received by São Paulo in royalties in 2020 3rd: Espírito Santo R$ 1.1 billion was received by Espírito Santo in royalties in 2020 45 45 $ The highest amou- nts in royalties originated from the following fields OFFSHORE Jubarte R$ 1.4 bi Roncador R$ 1.0 bi ONSHORE Fazenda R$ 24.1 mi Alegre Cancã R$9.9 mi Chart 29 Revenues from royalties in Espírito Santo in constant amounts (R$ millions)** Royalties are financial compensa- tions calculated 15 by applying one of the rates outlined in a contract, ranging between 5% and 15% of the income from the producing well (quantity of oil and natural gas extracted multiplied by the reference price16). In 2020, the neighboring producing fields in the territory of Espírito Santo paid R$ 3.0 billion in royalties, 98.2% of which resulted from the offshore activity and 1.8% from the onshore activity. The largest amounts were generated by the Jubarte (R$ 1.4 billion) and Roncador 17 (R$ 1.0 bil- lion) offshore fields, Fazenda Alegre (R$24.1 million), and Cancã (R$9.9) onshore. However, that total volume is not transferred only to Espírito Santo, provided that the royalties are distributed among the States, the municipalities and the Federal Gov- ernment, taking into account criteria such as the location of the produc- ing field (onshore or offshore) and the presence of installations that handle oil and natural gas. Still, in 2020, Espírito Santo re- ceived a total of R$ 1.1 billion in royalties. Approximately R$ 523.0 million were redirected to the State Government and R$ 547.0 million to the municipalities of Espírito Santo, amounts, respec- tively, 30.1% and 24.3% lower than those recorded in 2019. With these results, Espírito Santo recorded the third largest collec- tion of royalties among all Brazilian states, third only to Rio de Janeiro (R$9.9 billion) and São Paulo (R$1.7 billion), and accounted for 4.7 % of the total received by the Federal Government. The municipalities in Espírito San- to that received the most royalties in 2020 were: Presidente Kenne- $ The composition of Roy- alties payments made in Espírito Santo was the following: R$ 523 million were redirected to the State Government R$ 547 million were redirected to the Municipalities of Espírito Santo 2,500 2,250 2,000 1,750 1,500 1,250 1,000 750 500 250 0 2001 2002 2003 2004 2005 2006 2007 2008 2009 2010 2011 2012 2013 2014 2015 2016 2017 2018 2019 2020 Municipality of ES (*) Amounts with deflation according to the IPCA index (accumulated from Jan-Dec). Source: ANP | Prepared by: Ideies/Findes Estate of ES ing fields with high production of oil and natural gas and having fa- cilities for serving offshore activ- ity. Among them, Linhares is the only municipality with both on- shore and offshore activities. share of the royalties in their total revenues collected were: Presidente Kennedy (32.5%); Marataízes (26.7%) and Itapemirim (19.6%). Except for Linhares, these municipalities have the highest dependence on resourc- es from the royalties in the composi- dy (14.1%), Marataízes (14.2%), Linhares (12.8%) and Itapemirim (12.2%). Together they concen- trated 53.8% of the total of these municipal revenues (chart 29). This high value of shares is ex- plained by the fact that they are municipalities with areas border- The municipalities with the highest tion of their revenues (chart 31). 15. For more details on how the amount payable in royalties is calculated, see the box in chapter 3 of the 2019 Yearbook of the Oil Industry of Espíri- to Santo: https://portaldaindustria-es.com.br/ system/repositories/files/000/000/577/original/ Anuario_Petroleo-ES_2019_port.pdf?1588180009 16. The reference price of oil is calculated on a monthly basis by ANP, according to the monthly average of Brent-type oil, in US Dollars per barrel. The reference price for natural gas is calculated monthly by the sum of the products of the volu- metric fractions of NG. 17. The Roncador field also borders the State of Rio de Janeiro. Therefore, its royalties are also destined to the State Government of Rio de Janei- ro, and municipalities of Rio de Janeiro.#2446 ESPÍRITO SANTO OIL & NATURAL GAS YEARBOOK | 2021 CHAPTER 3 GOVERNMENT SHARE AND ECONOMIC IMPACTS 47 47 Chart 30 Municipalities of the State of Espírito Santo that received more royalties - % on the total royalties received by all municipali- ties of the State of Espírito 2020 Chart 31 Municipalities of Espírito Santo with the highest share in reve- nues from royalties in their total income (%) - 2020 Field Campo Grande Royalties Participação (%) 0.11 0.2% 32.5% Rio São Mateus 0.09 0.2% 14.4% 14.2% 12.8% 12.2% 26.7% Fazenda Cedro Norte 0.08 0.1% Córrego das Pedras 0.07 0.1% 4.0% 3.7% 3.3% 3.1% 2.6% 2.4% 2.4% 2.3% 1.9% 19.6% 17.5% 13.8% 11.4% 9.6% 8.5% 6.3% 5.3% Tucano 0.07 0.1% Biguá 0.05 0.1% Mariricu 0.04 0.1% Fazenda Cedro 0.04 0.1% Gaivota 0.03 0.1% Presidente Kennedy Jaguaré Vila Velha Fundão Presidente Kennedy Marataízes Itapemirim Piúma Fundão Jaguare Linhares Anchieta Divino de São Lourenço Alto Rio ΟΛΟΝ Mariricu Norte 0.03 0.1% Onshore Tabuiaiá 0.03 0.0% Guriri 0.02 0.0% Source: ANP | Prepared by: Ideies/Findes Rio Mariricu 0.02 0.0% Rio Itaúnas 0.02 0.0% Table 1 Royalties paid by oil and gas producing fields, onshore and offshore, in Espírito Santo - 2020 Cacimbas 0.01 0.0% Lagoa Bonita 0.01 0.0% Field Royalties Participação (%) Cancã Leste 0.01 0.0% (R$ millions) 24.11 45.1% Córrego Cedro Norte Sul 0.01 0.0% Cancã 9.90 18.5% São Mateus Leste 0.0019 0.0% Inhambu 4.70 8.8% Bem-te-vi 0.0005 0.0% Fazenda São Rafael 4.63 8.7% Lagoa Parda Norte 0.0001 0.0% Fazenda Santa Luzia 3.21 6.0% Total onshore 53.50 100.0% Fazenda São Jorge 1.44 2.7% Jubarte 1,460.2 49.1% Rio Preto Oeste 0.77 1.4% Roncador 1,033.8 34.8% Fazenda Queimadas 0.67 1.3% Argonauta 198.5 6.7% Onshore São Mateus 0.59 1.1% Frade 123.1 4.1% Lagoa Parda 0.52 1.0% Golfinho 80.7 2.7% Lagoa Suruaca 0.35 0.7% Rio Preto 0.33 0.6% Offshore Ostra 41.6 1.4% Baleia Anã 19.8 0.7% Rio Preto Sul 0.27 0.5% Peroá 7.6 0.3% Córrego Dourado 0.26 0.5% Abalone 2.7 0.1% Córrego Cedro Norte 0.23 0.4% Abalone 2.7 0.1% Jacutinga 0.23 0.4% Cangoá 1.4 0.0% PA-1BGM1ES_EST-T-476 0.21 0.4% Total offshore 2,972.2 100.0% Lagoa Piabanha 0.19 0.4% Seriema 0.14 0.3% Note: Royalties paid by producing fields in Espírito Santo were distributed among the municipalities, the State and the Federal Government. Source: ANP | Prepared by: Ideies/Findes#2548 ESPÍRITO SANTO OIL & NATURAL GAS YEARBOOK | 2021 CHAPTER 3 GOVERNMENT SHARE AND ECONOMIC IMPACTS Chart 32 Revenues from Special Shares in Espírito Santo in constant amounts (R$ million) 3,000 to 2019, the amounts paid in SS by these fields were respectively re- duced by -44.5% and -99.9%, and these results are explained by the lower production of oil and natural gas in both areas (Table 2). In the case of Rocandor, it was only in Q1 2020 that a positive net income was recorded for calculating the SS. 2,500 2,000 1,500 1,000 500 3.1.2. Special Shares (SS) The special share is a financial compensation paid by oil compa- nies that have fields with a high production volume 18. I.e., this is an extraordinary payment related to the productivity level of an area. The calculation of the amount to be paid in SS is made by applying progressive rates 19 on net reve- nues 20 from the quarterly produc- tion of each field. After the unification of Parque das Baleias 21, Espírito Santo passed to border two fields that generated special share resources in 2020: Jubarte (R$ 751.0 million) and Ron- cador (R$ 0.21 million). Compared Table 2 Special participations paid by fields bordering Espírito Santo - 2020* (R$ million) 0 49 49 Field Jubarte Roncador** 2019 3,170.50 751.04 Estate of ES Municipalities of ES 2020 Variation Source: ANP | Prepared by: Ideies/Findes 1,759.94 -44.5% 0.21 -99.97% (*) Amounts with deflation calculated according to the IPCA index (accumulated from Jan-Dec 2020). (**) The field also borders the State of Rio de Janeiro. Therefore, part of that amount is also distributed to the State Government and the municipalities in Campos dos Goytacazes and São Joao da Barra. Source: ANP | Prepared by: Ideies/Findes In 2020, Espírito Santo received a total of R$ 1.2 billion in special shares. Of that amount, R$ 997.1 million were allocated to the State government and R$ 249.3 million to the municipalities of Marataízes, Presidente Kennedy, Piúma, and Itapemirim, which border the fields that entail the SS. In 2020, compared to the same pe- riod of the previous year, revenues from special shares fell by 53.1% for the State government and the afore- mentioned municipalities in Espírito Santo. It is worth reminding that Es- pírito Santo beat the record in col- lection the of SS due to the signing of the contract to unify the Parque das Baleias in 2019, and therefore the comparison base was also atyp- ically high (Chart 32). In 2020, Espírito Santo was the sec- ond State that received the most revenues from special shares, sec- ond only to Rio de Janeiro (R$ 8.7 billion), which accounted for 5.2% the total special shares received by the country. The other States that received these resources were: São Paulo (R$1.1 billion), Amazonas (R$41.0 million), and Bahia (R$1.5 million). We point out that the unification of Parque das Baleias, through the "Settlement for Ending the Dispute Involving the Areas of the Contract and Concession BC-60", has also created a retroactive balance of the special share to be paid in 42 install- ments by Petrobras to the Federal Government (50%), to the Govern- ment of the State of Espírito Santo (40%) and the municipalities (10%) 22 of Itapemirim, Marataízes, Piúma, and Presidente Kennedy. In 2020 alone, Petrobras paid a to- tal of R$ 620.8 million in SS refer- ring to the execution of that agree- ment. Of that amount, R$ 248.3 million were destined for the Gov- ernment of the State of Espírito Santo and R$ 62.8 million for the municipalities of the State 23. Ranking of amounts received in Special Shares 1st: Rio de Janeiro R$ 8.7 billion Reais were received by Rio de Janeiro in Special Shares 18. Its regulation happens through Law 9.478/97 (Petroleum Act) and Decree 2.705/1998. 19. They vary according to the location of the well, the number of production years, and the quarterly production volume calculated. 20. ANP monitors the cost of oil companies so it may calculate that net income. Moreover, are also considered the projected deductions (roy- alties, investments in the exploration, overhead, depreciation, and taxes). 2nd: Espírito Santo R$ 1.2 billion billion was received by Espírito Santo in Special Shares 21. In April 2019 was signed the unification field in connection with the fields part of Parque das Baleias, composed by the areas of Jubarte, Baleia Azul, Baleia Franca, parts of Cachalote, and Pi- rambu, in the Campos Basin. With that, one single large producing field was formed, which is now called "Novo Campo de Jubarte" or simply "Jubar- te". That unification created a substantial volume of SS payments to Espírito Santo. For more de- tails, access the previous edition of this Yearbook: https://portaldaindustria-es.com.br/system/re- positories/files/000/000/952/original/Anuario_ Petroleo-ES_2020_port.pdf?1618494352 3rd: São Paulo R$ 1.1 billion billion reais were received by São Paulo in Special Shares 22. Pursuant to art. 50 of Law 9.478/97, the distri- bution of the special share is made in the following manner: i) 40% to the Ministry of Mines and Energy (MME) and 10% to the Ministry of the Environment (MMA), totaling 50% to the Federal Government; iii) 40% to the States; and iv) 10% to municipali- ties. In the case of Jubarte, the amount paid to the municipalities is distributed among Itapemirim (32.3045%), Marataízes (37.7702%), Piúma (0.3230%), and Presidente Kennedy (29.6023%). 23. Learn more about the ANP reports regarding the "Novo Campo Jubarte Agreement" at: https:// www.gov.br/anp/pt-br/assuntos/royalties-e-out- ras-participacoes/participacao-especial#2650 ESPÍRITO SANTO OIL & NATURAL GAS YEARBOOK | 2021 64 owners regularized to re- ceive payment for the use of land for the oil explora- 3.1.3. Payment to landowners The Petroleum Act 24 determines that concession holders also pay a rate, set between 0.5% and 1% 25, on the gross income from the pro- duction of oil and natural gas to the owners of the land where active tion and production activity wells are located. in Espírito Santo in 2020 496.1 thousand reais were paid by conces- sion holders to land owners in Espírito Santo in 2020 Espírito Santo onshore production happens only in the Espírito Santo Basin, located in the northern por- tion of the State. There were there 64 owners regularized for receiving the rate on the gross income of the wells located on their land in 2020, an amount 19.0% lower than what was recorded in 2019. In 2020, concession holders paid, without deducting income tax, R$ 491.6 thousand to landowners in Espírito Santo, which represent- ed 0.6% of the amount disbursed countrywide. In the comparison with 2019, this payment had an 89.0% retraction in the State. That reduction was caused by the natu- ral process of decline in the produc- tion of oil and natural gas onshore; due to the drop in the oil reference price and due to the movement in restructuring the onshore E&P ac- tivity in the State of Espírito Santo due to Petrobras' divestment. CHAPTER 3 GOVERNMENT SHARE AND ECONOMIC IMPACTS Chart 33 Number of land owners with a share in the production of oil and natural gas of Espírito Santo 126 116 110 98 102 100 102 98 89 79 64 2010 2011 2012 2013 2014 2015 2016 2017 2018 2019 2020 Source: ANP | Prepared by: Ideies/Findes 557 51 Table 3 Amounts received in government shares by the State and Municipalities of Espírito Santo (R$ millions)* 2008 2009 2010 2011 2012 2013 2014 2015 2016 2017 2018 2019 2020 Municipalities of ES 574.7 349.3 631.8 1178.0 1497.0 1424.5 1514.3 1714.0 743.7 927.8 1157.2 1253.5 796.2 State of ES 797.5 572.7 928.1 1735.1 2553.7 2271.2 2430.8 1000.4 1130.4 1514.0 2006.7 2872.1 1520.1 Total in Government Share Total in Brazil 43,539.8 30,260.4 37,586.7 41,889.0 48,615.2 46,360.9 48,518.7 30,372.1 20,669.4 34,465.4 55,138.3 58,477.3 46,707.2 % of Brazil 3.2% 3.0% 4.2% 7.0% 8.3% 8.0% 8.1% 8.9% 9.1% 7.1% 5.7% 7.1% 5.0% Municipalities of ES 497.2 271.6 529.2 970.0 1121.1 1123.6 1193.4 805.8 609.2 724.1 862.1 722.4 547.0 State of ES 487.5 261.8 517.6 903.1 1049.8 1067.7 1147.4 773.3 592.4 699.2 826.2 747.8 523.0 Royalties Total in Brazil 21,026.9 14,682.1 17,279.4 21,221.3 24,138.5 23,771.9 25,384.2 17,152.5 13,786.5 17,308.8 22,837.7 24,487.8 22,819.3 % of Brazil 4.7% 3.6% 6.1% 8.8% 9.0% 9.2% 9.2% 9.2% 8.7% 8.2% 7.4% 6.0% 4.7% Municipalities of ES 77.5 77.7 102.6 208.0 376.0 300.9 320.9 227.1 134.5 203.7 295.1 531.1 249.3 State of ES 310.0 310.9 410.6 832.1 1503.9 1203.5 1283.4 908.2 538.0 814.8 1180.4 2124.3 997.1 Special Share Total in Brazil 22,512.8 15,578.3 20,307.3 20,667.7 24,476.7 22,589.0 23,134.5 13,219.6 6,882.9 17,156.6 32,300.6 33,989.5 23,887.9 % of Brazil 1.7% 2.5% 2.5% 5.0% 7.7% 6.7% 6.9% 8.6% 9.8% 5.9% 4.6% 7.8% 5.2% Source: ANP | Prepared by: Ideies/Findes 24. Law 9.478 of 1997. 25. Landowners receive, every month, a share ranging between 0.5% in mar- ginal fields and 1% in the other cases (ANP Ordinance 143, of 09.25.1998).#2752 52 ESPÍRITO SANTO OIL & NATURAL GAS YEARBOOK | 2021 CHAPTER 3 GOVERNMENT SHARE AND ECONOMIC IMPACTS 53 11.462 formal employees were employed in Espírito Santo in the oil and natural gas production chain Distribution of employees in the oil and natural gas sector by links in the chain in 2020 3.2. Labor market The oil and gas industry pro- motes the growth and improve- ment of the job market. In this yearbook, the oil sector chain in the State of Espírito Santo was segmented into five links26: (i) ex- ploration and production (E&P), also known as upstream, which consists of the actual extraction and production activities of O&G; (ii) derivatives, which are activi- ties related to the processing of oil and natural gas; (iii) supply, which consists of processing and trading of 27 O&G products; (iv) petrochemicals, which is a branch of the chemical indus- try that uses oil and natural gas as input; and (v) supply chain 28, which includes the industrial ac- tivities that provide specific prod- ucts and services for E&P activi- ties (see Appendix II). In 2020, the oil and gas produc- tion chain employed 11,462 formal employees in Espírito Santo, repre- senting 2.9% of the national chain and 1.3% of all employment in the State (Table 4). These numbers in the Espírito Santo industry were distributed in: 63.5% in the sup- ply chain link; 28.0% in E&P; 7.1% in supply; 1.3% in petrochemicals; and 0.1% in petroleum byproducts. In comparison with 2019, there was a 2.8% increase in the number of employees in the oil and natural gas industry in the state, a result driven by the expansions of: 6.5% in E&P, 1.7% in the supply chain; and 11.3% in petrochemicals. Still, -in the transition from 2019 to 2020, the total number of for- mal jobs in Espírito Santo de- creased by 0.7%, due to the new Coronavirus pandemic. However, in the production chain of the oil and gas sector, this drop was not seen, possibly due to the follow- ing reasons: i) due to the intensity of capital employed, the techno- logical complexity, and the high degree of knowledge necessary to perform certain activities, the workforce is usually specialized and requires an advanced level of training. The layoff in an un- certain scenario is not strategic for companies; ii) as an essential activity, E&P was not interrupted by government decree, and iii) federal and state programs to en- courage job maintenance during the pandemic helped the industry maintain formal employment. Due to the multidisciplinarity re- quired to carry out activities in the Table 4-Formal jobs in the chain of the O&G production sector in Espírito Santo Links in the Chain 2007 2008 2009 2010 2011 2012 2013 2014 2015 2016 2017 2018 2019 2020 E&P 2,278 2,636 2,818 2,914 3,192 3,251 3,087 3,207 3,071 2,883 2,518 2,439 3,011 3,207 Chain of Supply 63.5% Oil byproducts 97 86 91 197 102 91 95 33 31 15 17 16 19 15 Petrochemicals 20 35 51 53 51 0 123 123 125 133 148 E&P 28.0% Supply 501 563 669 642 674 730 804 820 835 807 787 739 827 817 Supply 7.1% Chain of Supply 4,942 7,703 7,633 6,060 6,868 8,223 7,186 7,630 7,143 5,981 6,232 7,107 7,155 7,275 Total 7,838 10,995 11,217 9,815 10,871 12,346 11,225 11,741 11,080 9,809 9,677 10,426 11,145 11,462 Petrochemical 1.3% % of the total jobs in ES 1.0% 1.4% 1.4% 1.1% 1.2% 1.3% 1.2% 1.2% 1.2% 1.1% 1.1% 1.2% 1.2% 1.3% Oil byproducts 0.1% % of the ES chain in the total 2.1% 2.6% 2.6% 2.1% 2.1% 2.3% 2.1% 2.3% 2.3% 2.3% 2.5% 2.7% 2.8% 2.9% of the same chain in Brazil Source: Rais/ME | Prepared by: Ideies/Findes 26. In this edition of the yearbook, the oil and natural gas sector chain was expanded from 3 to 5 links, now including oil derivatives/byprod- ucts and petrochemicals. We must highlight that for the composition of the sector chain and the possibility of extracting information from official sources, it is necessary to use the National Clas- sification of Economic Activities 2.0 (CNAES), and in this edition, previously used CNAES were reclassified and new ones were added to that list (see Appendix II). Moreover, it is a known fact that the structuring of a production chain, whether in the oil and gas sector, or in any other sector of economic activity, through CNAES is limited, since many companies can operate in different activities, which are not covered by the CNAE in which it is classified. 27. In this chain, the retail fuel trade was not con- sidered because this activity exists in practically all regions of the country, regardless of whether or not the region has O&G exploration and pro- duction activities. 28. In this yearbook, the chain covers the CNAES which IBGE describes as an activity that supplies raw materials or provides a service to the oil and natural gas industry.#2854 ESPÍRITO SANTO OIL & NATURAL GAS YEARBOOK | 2021 CHAPTER 3 GOVERNMENT SHARE AND ECONOMIC IMPACTS 55 55 Chart 34-Distribution of formal employees in the chain of production of the O&G industry - Espírito Santo 14,000 12,000 10,000 8,000 6,000 4,000 2,000 0 2007 2008 2009 2010 2011 2012 2013 2014 E&P Oil Byproduct Petrochemicals 2015 2016 2017 2018 2019 2020 Supply Chain of Supply 38.6% 37.6% of workers in the oil and natural gas industry were between 30 and 49 years old in 2020 industry's production chain has differences between the links that compose it. In the E&P link, the average compensation reaches R$ 16,502.43, while in the supply chain the average is R$ 2,532.71. of employees in the oil and natural gas industry were over 50 years old in 2020 Another point that draws atten- tion is the salary difference paid in the oil derivatives link in Espírito Santo and Brazil (chart 35). Distribution of education levels of employees in the oil and natural gas industry in 2020: High School College Education Master's Degree 56.6% 23.9% 2.6% Source: Rais/ME | Prepared by: Ideies/Findes 13.9% of workers in the oil and natural gas industry worked in the area of as- sembly of pipes, metallic structures and composites 7.2% of workers in the oil and natural gas industry worked as engineers, architects and in similar professions oil and natural gas industry, the profile of workers that make up the industry's chain is heterogeneous, covering various occupations, dif- ferent age groups and levels of qualification, and different average salaries (Table 5). In 2020, 13.9% of workers worked in the area of assembly of pipes, metallic, and composite structures; and 7.2% were engineers, architects, and similar professionals. The occupation that employed the most that year was welder (518), followed by oil exploration operator (465) and administra- tive assistants (404). Moreover, the O&G chain employed 55.0% of machine operators and 35.1% of steel structure preparers in Es- pírito Santo. Regarding the age group (Table 5), 38.6% of the workers in the O&G Espírito Santo chain were be- tween 30 and 49 years old (4,421) and 37.6% of the employees were over 50 years old, in 2020. Regarding workers' education, at least 23.9% had a college degree and 56.6% had a High School di- ploma. The oil and gas industry in Espírito Santo absorbs 2.6% of employees with a master's degree in the state. As a result of the qualification of its employees, the average monthly compensation in the O&G sector in Espírito Santo was R$ 6,622.79 and countrywide, it was R$ 6,031.60 in 2020. These amounts were higher than the total average monthly compensa- tion of the state (R$ 2,547.42) and the country (R$ 2,924.32). The average wage of the O&G Chart 35 - Average monthly wage of the links of the chain of production in the O&G industry, 2020 - Espírito Santo and Brazil (R$ thousands) 16,502.4 15,167.3 16,668.0 7,196.8 4,066.1 4,796.2 5,088.4 2,759.3 2,532.7 3,087.0 E&P Oil Byproducts Petrochemicals Supply Supply Chain ES BR Source: Rais/ME | Prepared by: Ideies/Findes#2956 Table 5 Characteristics of the jobs market of the O&G chain in Espírito Santo - 2020 ESPÍRITO SANTO OIL & NATURAL GAS YEARBOOK | 2021 CHAPTER 3 GOVERNMENT SHARE AND ECONOMIC IMPACTS ES BR % ES in the Brazilian chain % in the total of the State of ES % ES in the % in the total ES BR Brazilian of the State chain of ES Main Occupations Education Level Welder 518 13,922 3.7% 11.3% Illiterate 13 592 2.2% 0.5% Oil exploration operator 465 8,471 5.5% 100.0% Up to 5th grade - Incomplete 80 4,694 1.7% 0.4% Administrative assistant 404 15,035 2.7% 1.2% Metal structure preparer 283 2,720 10.4% 35.1% 5th Grade Elementary School - Complete 6th to 9th Grade of Elementary School 73 4,718 1.5% 0.4% 345 13,342 2.6% 0.8% General machine maintenance mechanic 249 6,203 4.0% 4.1% Elementary Education - Complete 610 26,831 2.3% 0.9% Truck driver (regional and international routes) 245 13,366 1.8% 1.1% Machine tool operator 242 1,478 16.4% 55.0% Mechanical technician 240 4,713 5.1% 12.0% General office assistant 222 11,444 1.9% 0.6% Stockroom Clerk 219 5,642 3.9% 3.0% Metal structure assembler 219 6,575 3.3% 10.7% Job subgroup Workers in assembly of pipes, metal and composite structures High School - Incomplete Complete High School Incomplete College Education Complete College Education Master's Degree Doctorate Degree Total average compensation amount (R$) Source: Rais/ME | Prepared by: Ideies/Findes 762 19,151 4.0% 1.3% 6,490 206,145 3.1% 1.5% 353 19,312 1.8% 1.1% 2,511 94,127 2.7% 1.3% 203 4,251 4.8% 2.6% 22 699 3.1% 0.3% R$ 6,622.79 R$ 6,031.60 1,593 37,544 4.2% 13.2% Engineers, Architects and similar professionals 829 17,910 4.6% 21.2% Clerks in general, agents, assistants and administrative assistants 649 26,995 2.4% 0.9% Vehicle drivers and operators of lifting and handling equi- pment 615 23,459 2.6% 1.3% Operators of facilities in chemical, petrochemical and re- lated industries 505 15,195 3.3% 27.3% Electronics and photonics technicians 504 10,072 5.0% Metalwork technicians 494 8,978 5.5% 8.6% 14.8% Age Range 10 to 14 2 14 14.3% 1.3% 15 to 17 49 49 1,290 3.8% 0.7% 18 to 24 1,147 35,620 3.2% 1.0% 25 to 29 1,536 49,313 3.1% 1.3% 30 to 39 4,421 140,151 3.2% 1.6% 40 to 49 2,852 98,987 2.9% 1.3% 50 to 64 1,399 63,168 2.2% 0.9% 65 OR MORE 56 5,319 1.1% 0.4% 3.3. External Sector The production of the oil and natu- ral gas industry can be consumed internally in the country, after being processed, or sold abroad. These In comparison with 2019, the vol- ume of exports of the oil and natu- ral gas industry retracted by 44.3%. This lower performance in the for- 599 million were exported by the whole exports range from crude oil, pe- eign market was mainly caused by oil industry in Espírito Santo troleum coke, oil byproducts, and the Covid-19 pandemic, decreed in petrochemical products. The total value exported by the Es- pírito Santo oil industry totaled R$ 599 million in 2020, which repre- sented 2.2% of the sector's foreign sales in the country and 12.1% of the total exported by Espírito Santo. Among all Espírito Santo sectors, these were the sixth largest foreign sales figures. March 2020 by the World Health Organization (WHO), which led sev- eral countries to adopt measures of social distancing and isolation, which proved to reduce economic activities and mobility of people. As a result, there was a reduction in international demand for oil and natural gas. 57 40#30Exported Valu (US$ million) 58 ESPÍRITO SANTO OIL & NATURAL GAS YEARBOOK | 2021 CHAPTER 3 GOVERNMENT SHARE AND ECONOMIC IMPACTS Chart 36-Exports of oil and share in exports of oil in the total exports of Espírito Santo 2,500 2,000 1,500 1,000 500 dub. 0 2010 2011 2012 Exports of Oil Source: MDIC/Secex | Prepared by: Ideies/Findes Portion in the total exports by ES. 2013 2014 2015 Table 6 - Exports of the oil industry in Espírito Santo (US$ FOB millions) 25% 20% 15% 10% 5% 0% 2016 2017 2018 2019 2020 Share in total exports (%) Participation in the total exported by ES Total exports Crude Oil Coking and oil bypro- ducts Petrochemical Products Period Total ES % ES/BR Total ES % ES/BR Total ES % ES/BR Total ES % ES/BR 2010 899 3.9% 899 5.6% 0.0 0.0% 0.0 0.0% 2011 1,512 4.9% 1,511 7.0% 0.0 0.0% 1.5 0.0% 2012 1,323 4.4% 1,322 6.6% 0.0 0.0% 0.3 0.0% 2013 934 4.3% 932 7.2% 0.0 0.0% 1.9 0.0% 2014 2,006 8.1% 2,001 12.2% 0.001 0.00003% 5.6 0.1% 2015 1,130 6.6% 1,128 9.6% 0.07 0.004% 1.9 0.1% 2016 467 3.2% 465 4.6% 0.0 0.0% 1.6 0.0% 2017 924 4.2% 920 5.7% 0.0 0.0% 4.3 0.1% 2018 1,004 3.1% 960 3.8% 38.5 0.9% 5.6 0.2% 2019 1,075 3.2% 1,014 4.2% 58.8 1.0% 1.6 0.1% 2020 599 2.2% 567 2.9% 30.4 0.6% 1.7 0.1% Source: MDIC/Secex | Prepared by: Ideies/Findes The total of imported products, considering the oil industry in Es- Foreign sales of crude oil by Espírito Santo alone totaled US$ 567 million in 2020 (or 94.6% of the total ex- ported by the Espírito Santo sector), an amount US$ 448 million lower than what had been recorded in the previous year. This year, this prod- uct was exported only to: Malaysia (58.5%), the United States (14.0%), India (8.6%), Saint Lucia (6.5%), Chi- na (5.7%); Singapore (3.5%), and In- donesia (3.1%) (Figure 1). Also in 2020, exports of petroleum coke products and oil byproducts totaled US$ FOB 30.4 million, an amount 48.3% lower than what was recorded in 2019. Furthermore, foreign sales of petrochemical products corresponded to US$ 1.7 million, an amount 5.4% higher than the amount recorded in the imme- diately previous year. Table 7-Espírito Santo imports of products from the oil industry (US$ FOB millions) Total exports Crude Oil Coking and oil bypro- ducts Petrochemical Products Period Total ES % ES/BR Total ES % ES/BR Total ES % ES/BR Total ES % ES/BR 2010 313 0.9% 0 0.0% 46.3 0.4% 266.3 4.0% 2011 283 0.6% 0 0.0% 17.1 0.1% 266.3 3.2% 2012 264 0.6% 0 0.0% 34.6 0.2% 229.5 2.9% 2013 203 0.5% 0 0.0% 37.8 0.2% 164.8 1.9% 2014 183 0.4% 0 0.0% 35.530 0.2% 147.4 1.8% pírito Santo, totaled US$ 140 million in 2020, an amount 30.4% higher than what was recorded in the pre- Ivious year. Of this amount, 61.0% refers to the import of petroleum coke and derivatives and 39.0% to 2015 218 0.8% 0 0.0% 67.03 0.7% 151.0 2.4% 2016 122 0.5% 0 0.0% 33.8 0.4% 87.7 1.7% 2017 129 0.4% 0 0.0% 81.1 0.6% 48.2 0.8% 2018 118 0.3% 0 0.0% 46.3 0.3% 71.2 1.0% 2019 108 0.2% 0 0.0% 51.6 0.4% 56.0 0.9% petrochemical products (Table 7). 2020 140 0.4% 0 0.0% 85.6 1.0% 54.7 0.9% Source: MDIC/Secex | Prepared by: Ideies/Findes 59#3160 60 Figure 1 Main destinations of exportations of crude oil of Espírito Santo in 2020 0 Netherlands- US$ 17.5 million Indonesia US$ 20.1 million Syngapore US$ 32.4 million - China US$ 36,9 mi India US$ 49,0 mi United States - US$ 79.5 million Malaysia- US$ 331.6 million Source: MDIC/Secex | Prepared by: Ideies/Findes 61 67 A Until the 4th edition of the Espírito Santo Petroleum Industry Year- book, products "Repetro-Eligible of originating from Repetro" in for- eign trade analyses. Repetro is a special customs re- gime that allows an agent autho- rized by the Federal Revenue Ser- vice of Brazil to export and import a list of goods intended for re- search and exploration activities in oil and natural gas deposits, through temporary admission 29, fictitious export 30, and draw- back 31. As of the date of this pub- lication, this permitted list con- sisted of 124 NCMs 32 that could benefit from this special customs regime. It is worth noting that these listed items are not fixed, and are changed upon approval of the inclusion or suppression of certain products in the Regulatory Directive that governs Repetro. Since it is not possible to disag- gregate official foreign trade data into products that have or have not benefited from Repetro, ex- ports and imports of NCMs cov- ered by this special regime could overestimate the flow of foreign transactions intended for serving the oil and gas industry in Espírito Santo. The reason for that is that said list contains products that do not exclusively serve the O&G industry. Consequently, starting with this 5th edition of the Espírito Santo Oil Industry Yearbook, we chose to remove Repetro-Eligible products from our foreign trade analysis. 29. Import, with a total suspension of payment of federal taxes, in the case of goods used in the exploration and production of oil and gas with the commitment to be re-exported. 30. Export, without leaving the customs area, based on the transfer of ownership of the goods to a corporate entity domiciled abroad. 31. Import of inputs for the production of goods that will be re-exported. Drawback suspends some taxes and fees, such as PI, PIS import, CO- FINS import, AFRMM and ICMS. 32. Common Mercosur Nomenclature (NCM) is a type of classification for imported and exported products, mainly based on the Harmonized Sys- tem (HS Code). BOX 1 - "REPETRO"-ELIGIBLE PRODUCTS#32CAPÍTULO 4| RESEARCH, DEVELOPMENT AND INNOVATION Chapter 4 RESEARCH, DEVELOPMENT AND INNOVATION Innovation is a key point for the development of technological solutions in the Oil and Gas (O&G) industry. Having said that, encour- aging research, development, and innovation (RD&I) in the O&G in- dustry is essential for maintaining the industry's production capacity and competitiveness. The development of these solu- tions covers topics such as pro- duction, processing, well engineer- ing, safety, and the environment, among others. These innovations become fundamental for the de- velopment of new technologies for the industry and for the safety of workers. In this context, the Re- search, Development, and Innova- tion (RD&I) Clause remains an im- portant incentive mechanism for the production of knowledge and new technologies for the industry. 4.1. The RD&I Clause Signed in the oil and natural gas exploration and production con- tracts, this provision establishes the investment of a percentage of the gross revenue from pro- duction in research, develop- ment, and innovation projects and programs by oil companies. The amounts generated are in- vested in RD&I projects that can be developed by the Oil Compa- ny itself, by Brazilian Companies, or by Accredited Institutions throughout the country. The financing of these projects, according to the clause, began in 1998, the year after the enact- ing of the Petroleum Act (Law 9.478/97), but was only regulat- ed in 2005 by ANP Resolution 05/2005). In 2015, this regulation was re- placed by the current one, coming into force in the following year. As of this last resolution, com- panies supplying O&G goods and services and technology-based companies were able to use the resources under the aforemen- tioned clause. Moreover, stan- dards, definitions and procedures were established for the three models of oil and natural gas exploration and production con- tracts practiced in the country³³ In 2019, the ANP approved the revision of the regulation and the changes expanded the possibili- ties of operations by research in- stitutions and encourage the ex- ecution of projects in partnership between universities and com- panies 34. This change opened up the possibility of creating a more dynamic and productive innova- tion environment with a diversity of players. 2019 ANP approved the revision of ANP Technical Regula- tion 3/2015. The changes have ex- panded the possibilities for research institutions to operate, they encourage the execution of projects in partnership between universities and companies and allow for the execution of new models of projects and programs 33. In concession contracts, the RD&I provides that concession holders shall incur qualified ex- penses such as research and development in amounts corresponding to 1% (one percent) of the gross revenue from production of the fields paying the Special Share. In production sharing and trans- fer of rights contracts, the value of the obligation corresponds to, respectively, 1% (one percent) and 0.5% (half percent) of the annual gross revenue of the fields belonging to the blocks detailed and out- lined in the respective contracts. 34. The changes are contained in resolution 799, of September 2, 2019, which are available http://www.anp.gov.br/images/Pesquisa_ Desenvolvimento/Investimentos_PDI/Regulam- entacao_tecnica/resolucao-799-2019.pdf at: 63 63#3364 ESPÍRITO SANTO OIL & NATURAL GAS YEARBOOK | 2021 CAPÍTULO 4| RESEARCH, DEVELOPMENT AND INNOVATION 65 55 Figure 2- Regulatory Time Line of RD&I Projects Research, Development, and Innovation Projects (RD&I) started receiving the resources provided in the oil, and natural gas exploration and production contracts in 1998 1998 The regulation was replaced by ANP Resolution 50/2015 and ANP Technical Regulation 3/2015 and it sets forth the definitions, guidelines and standards for the investment of resources as well as the rules for proving the activi- ties have been performed. 2015 By 2020, no company in Espirito Santo had developed a research, development and inno- vation project with the resources under the RD&I Clause In 2021 Mogai Tecnologia Started a project with re- sources from the clause as the executing company. 2021 Approval of ANP Resolution 866 of February 11, 2022, amending ANP Technical Regulation 3 of 2015, which addresses the rules for investment of the resources. 2022 The RD&I Clause Source: ANP | Prepared by: Ideies/Findes 2005 The application of the resources provided in the RD&I clauses was originally regulated by Resolu- tion 33/20005 and the respective Technical Reg- ulation 5/2005 2019 ANP Technical Regulation 3/2015 (standards for application of resources) was improved by ANP Resolu- tion 799/2019 And ANP Technical Regulation 7/2012 (accreditation of institutions) was improved by ANP Resolution 775/2019 The revisions of the regulations expanded the possibilities of operations by research institutions, encourag- ing the execution of projects in partnership between universities and companies. 2022 In February 2022, the ANP approved the resolution that improves the rules for the application of RD&I resources The new version of the resolution proposes grea- ter clarity on the eligibility of RD&I projects relative to renewable energies and the energy transition, including de-carbonization, CO2 cap- ture and characterization and environmental protec- tion studies. 4.2. Obligations created by the RD&I clause in Brazil Between 1998 and June 2021, the RD&I clause generated in Brazil approximately R$ 20.0 billion in volume of obligations, where Petro- bras was responsible for R$ 17.3 billion (86.1%). In 2020 (the last year with information available for the 12 months), the amount generated in obligations under the clause was R$ 1.46 billion, a 24.4% decrease compared to 2019. Petrobras' relative share compared to other oil companies in 2020 was 72.6%. Despite this result repre- senting a concentration, there is an increase in the participation of oth- er companies, which was 16.6% in 2015 and rose to 27.4% in 2020. R$ 1.47 billion Reais have been generated in obligations in connection with the RD&I Clause in 2020, a 24.4% drop relative to 2019#34(In billions) 66 Chart 37 RD&I Investment Obligations, per annum 2.2 2.0 1.8 1.6 1.4 1.2 1.0 0.8 0.6 0.4 0.2 0.0 0.00 0.09 0.26 0.09 0.13 0.32 0.40 0.51 0.62 0.62 0.86 1998 1999 2000 2001 2002 2003 2004 2005 Source: ANP | Prepared by: Ideies/Findes 1 until June 2021 Information extracted on: 10/25/2021 Total 2006 ESPÍRITO SANTO OIL & NATURAL GAS YEARBOOK | 2021 1.03 0.75 Q.64 1.23 1.26 Petrobras Other Companies 1.42 2.03 1.93 1.46 1.30 1.23 1.06 0.86 2015 2016 2017 2018 2019 2020 20211 CAPÍTULO 4| RESEARCH, DEVELOPMENT AND INNOVATION Chart 39 Number of projects started that received resources under the RD&I clause in Brazil 171 160 1.047 946 892 639 592 583 557 514 404 ANP Technical Regulations 5/2005 Source: ANP | Prepared by: Ideies/Findes Data until 09/29/2021 Data collected on 10/25/2021 461 473 493 417 361 360 318 293 594 603 705 177 148 2012 2013 2014 2015 2016 2017 2018 2019 2020 20211 ANP Technical Regulations 3/2005 Chart 38 - RD&I Investment Obligations by Oil Company, in billions (2020) R$ 0.04; 3% R$ 0.07; 5% R$ 0.24; 16% Source: ANP | Prepared by: Ideies/Findes Data collected on 10/25/2021 4.3.Projects and programs developed using the RD&I clause Between 1998 and June 2021, 11,908 projects were developed in Brazil financed with resources from the obligations generated by R$ 0.03; 2% R$ 1.06; 73% the Clause. When comparing 2020 (177) with 2019 (705), the number of projects dropped by 74.9% and was the lowest volume of projects Petrobras Shell Petrogal Brasil RepSol Sinopec Petronás Equinor Total 74.9% was the drop in the num- ber of projects generated in connection with the RD&I Clause between 2019 (705) and 2020 (177) since 1999 (160). The peak in the number of projects developed with the resources under the clause oc- curred in 2005 (1,047). It is important to note that the reduction in the number of proj- ects between 2019 and 2020 is mainly related to the impacts of the Covid-19 pandemic on the global and Brazilian economies. Several projects developed by re- search institutions, for example, require face-to-face activities, which were suspended for sever- al months in 2020. In Espírito Santo, between 2000 and June 2021, 90 projects were fi- nanced with resources from the ob- ligations generated by the Clause. Of these projects, 87 were execut- ed, or are being executed, by UFES, 1 by IFES, 1 by UCL, and 1 by the company Mogai Tecnologia. The largest number of projects start- ed in 2019 (16), significantly higher when compared to 2018 (5), and the largest volume since 2000, the first year that a project took place in the State (according to data provided by the ANP). In the years 2001, 2009, and 2017 no project was executed. In 2020, the three projects devel- oped in the state represented 0.5% of the total in Brazil. In 2019, they represented 2.5%. The projects developed in Espíri- to Santo covered the areas of re- search on supply, exploration and production, natural gas and trans- versal themes, subdivided into 8 themes, and 12 sub-themes (as de- tailed below). $ 90 projects financed with resources from the obli- gations generated by the RD&I clause were devel- oped in Espírito Santo between 2000 and 2021 UFES 87 IFES UCL projects project project Mogai 1 Tecnologia project 67 67#3568 ESPÍRITO SANTO OIL & NATURAL GAS YEARBOOK | 2021 CAPÍTULO 4| RESEARCH, DEVELOPMENT AND INNOVATION R$ 49.2 million Considering only the projects in con- nection with ANP Technical Regula- tion 03/2015, which is made avail- able by the ANP with more detailed information about the projects and their values, between 2016 and June 2021, 1,968 projects were executed in Brazil with the resources under the Clause, with a value of R$ 8.30 billion. was the amount obtained in connection with the RD&I clause in 25 projects devel- oped in Espírito Santo be- tween 2016 and June 2021 In Espírito Santo, evaluating the projects under current regulation, 25 projects were executed with the resources under the Clause in the same period, amounting to a total of R$ 49.15 million. Of these proj- ects, 24 were executed by UFES and 1 by Mogai Tecnologia. The projects developed in Espírito Santo investigat- ed supply, exploration and production, natural gas and transversal themes, subdi- vided into 8 themes and 12 sub-themes Figure 3 - Area, theme and sub-theme of the Projects - Espírito Santo AREA THEME Chart 40-Projects started that received resources under the RD&I clause in Espírito Santo (number of projects) 20 15 10 5 2 0 0 2 14 13 6 6 4 3 3 3 3 1 69 00,0% 16 8,0% 6,0% 4,0% 5 2,0% ANP Technical Regulations 5/2005 ANP Technical Regulations 3/2005 -% ES/BR Source: ANP | Prepared by: Ideies/Findes Data until 09/29/2021 Data collected on 10/25/2021 SUB-THEME -0,0% SUPPLY (1) EXPLORATION AND PRODUCTION (17) REFINEMENT (1) WELL ENGINEERING (4) EXPLORATION (1) PRODUCTION (11) NATURAL GAS (5) ADVANCE RECOVERY (1) TRANSVERSAL THEMES (2) Source: ANP | Prepared by: Ideies/Findes PRODUCTION AND PROCESSING (5) CONFORMITY ASSESSMENT (5) SAFETY AND ENVIRONMENT (1) OIL PROCESSING (1) AUTOMATION, CONTROL, INSTRUMENTATION AND METROLOGY 3) FORMATION - WELL INTERFACE (1) DRILLING AND COMPLETION - TECHNICAL AND TECHNOLOGICAL (1) DEVELOPMENT OF NEW ALGORITHMS (1) CHARACTERIZATION AND PROCESSING OF FLUIDS (4) ENVIRONMENTAL IMPACTS (2) OUTFLOW PROCESSING METHODS (4) UNDERWATER PUMPING TECHNIQUES AND EQUIPMENT (1) RESERVOIR CHARACTERIZATION AND ENGINEERING (1) ON BOARD PROCESSING (5) MODELING AND PREVENTION OF ENVIRONMENTAL IMPACTS (1)#3670 ESPÍRITO SANTO OIL & NATURAL GAS YEARBOOK | 2021 CAPÍTULO 4| RESEARCH, DEVELOPMENT AND INNOVATION 71 4.4. Funders and executors of projects financed under the RD&I Clause Research and development proj- ects executed with resources from the Clause can be execut- ed by the oil company, research institutions, and Brazilian com- panies. In the case of the last two, the studies developed aim at meeting the specific demands of oil extraction and production companies. An RD&I project can 4.4.1. Main financing and executing companies Petrobras stands out in terms of the number of projects financed (1,611), as expected, the company also generates a greater volume of funds from RD&I obligations. Shell Brasil, with 187 projects financed, takes the second position as the largest company that finances be carried out by one or more accredited companies or insti- tutions and financed by one or more oil companies. RD&I projects. In Espírito Santo, the company that financed all proj- ects was Petrobras. Regarding the companies execut- ing these projects, Petrobras also stands out, having participated in 525 projects, followed by Shell (103 projects) and Repsol Sinopec (45 projects). Until 2020, no company in Espírito Santo had developed research, development and innova- tion projects with these resources. However, the state already showed potential to do so, standing out in public notices in the oil and gas sector, such as in the Repsol-Sino- pec Digitization Challenge 35, in Lay- er 2019 of FindesLab with the Shell Brasil Challenge 36, in The Connec- tions Regulations for Innovation of Petrobras and Sebrae 37, and in the 2020 Digital Oil and Gas Mission, of ApexBrasil³8 In 2021, the company Mogai from Espírito Santo, which operates in the field of cutting-edge technol- Chart 42 - Number of projects started by the main executing companies in Brazil Mogai was the first company in Es- pírito Santo that developed a project with resources from ANP'S RD&I Clause. Chart 41 Quantity of projects started by funder, in Brazil Petrobras Shell Brasil 187 Repsol Sinopec 52 Totalenergies EP 41 Petrogal Brasil 38 Equinor Brasil 37 Bg Brasil 31 Cnodc Brasil 25 Cnooc Brasil 25 Equinor Energy 21 Sinochem Petróleo 12 Enauta Energia 6 יכ Geopark Brasil 3 Parnaíba Gás Natural 3 Eneva 2 Petrorio 2 1,611 Petrobras 525 Shell Brasil 103 Repsol Sinopec 45 Equinor Brasil 25 Bg Brasil 20 Equinor Energy 17 Totalenergies Ep 16 Schlumberger 14 Sinochem Petróleo 14 Engineering Simulation And Scientific Software Ltda 12 Halliburton 8 Petrogal Brasil 8 Source: ANP | Prepared by: Ideies/Findes Note: A project can have more than one executing company. Data until 09/29/2021 Data collected on 10/25/2021 Source: ANP | Prepared by: Ideies/Findes Note: The total number of projects exceeds 1,968 as a project can have more than one financing company. Data until 09/29/2021 Data collected on 10/25/2021 35. Of the five companies approved in the public notice, two were from Espírito Santo: Mogai and Factum. The challenge was to develop new tech- nological solutions for the industry through arti- ficial intelligence techniques, robotic equipment, computer modeling, or digitalization. 36. Shell's challenge was led by companies from Espírito Santo, with 14 projects submitted, and 1 was selected from Espírito Santo startup, Dersalis. 37. In this public notice, 2 Espírito Santo companies were selected in the 1st phase: Mogai and Wize Company. 38. For this program, 150 enrollments were recorded countrywide, 75 of which were validated. Of the 30 companies selected in phase 1 (innovation), 6 are from Espírito Santo: Endserv, 2Solve, Inside, Marca Ambiental, R1 Engenharia and Vixteam, which were referred by Shell, Petrobras, Equinor and Eneva, the operators participating in the mission. The mission also had 4 companies from Espírito Santo (2solve, Orion, R1 Engenharia and VPS Group) among the 25 companies selected for phase 2, which address- es internationalization, with training, customized agendas for international business development and access to industry content.#3772 22 ESPÍRITO SANTO OIL & NATURAL GAS YEARBOOK | 2021 CAPÍTULO 4| RESEARCH, DEVELOPMENT AND INNOVATION 73 33 24 is the number of proj- ects using resources in connection with the RD&I Clause executed by Universidade Federal do Espírito Santo (UFES) In Espírito Santo, there are 3 institutions accredited by the ANP to carry out proj- ects with resources from the RD&I Clause: 1. Universidade Federal do Espírito Santo (UFES) 17 research units 2. Instituto Federal do Espírito Santo (IFES) 4 research units 3. Universidade de Vila Velha (UVV) 1 research unit ogy, was the first company in Es- pírito Santo to develop a project with the resources under the ANP's RD&I Clause. The objective of the project is to reduce the cost of the corrosion of the platforms39. Chart 44 Accredited research units in Brazil, by State (10 or more research units 400 361 4.4.2. Main executing institutions In Brazil, until September 20, 2021, there were 165 research institutions registered with the ANP to carry out projects with resources under the RD&I Clause. These institutions are divided into 1,013 research units. The state with the most registered insti- tutions was Rio de Janeiro (33), fol- lowed by São Paulo (25). In Espírito Santo there are 3 ac- credited institutions: Universidade Federal do Espírito Santo (UFES), Instituto Federal do Espírito Santo (IFES) and Universidade de Vila Vel- ha (UVV). These 3 institutions to- gether have 22 registered research units, 17 of which are located at UFES, 4 at IFES and 1 at UVV. Chart 43 - Accredited institutions in Brazil, by State (above 3 institutions) 33 25 17 15 10 10 99 8 5 4 3 3 3 3 3 300 200 164 100 0 89 63 63 55 55 40 39 36 36 22 19 19 18 17 10 RJ SP MG RS SC PR BA RN PE ES PE DF SE CE PA Source: ANP | Prepared by: Ideies/Findes Note: MT, PA, PI and RN have 2 institutions; AC, AL, AP, GO, MA, RR and TO have 1 institution; RO does not have any accredited institutions. Analyzing the main institutions ex- ecuting projects initiated in Brazil with the resources under the RD&I Clause, UFRJ participated in 266 projects, PUC-RJ in 142, USP in 98 and Unicamp in 96. Universidade Federal do Espírito Santo (UFES) executed 24 projects using the re- sources under the clause. Chart 45 - Number of projects started according to the main executing institutions, in Brazil 266 UFRJ POC-RJ 142 USP 98 UNICAMP 96 RJ SP MG RS PR DF BA SC PE SE PB MS ES CE AM SENAI 73 UFRGS 69 UFSC 41 Source: ANP | Prepared by: Ideies/Findes UFF Note: MT, PA, PI and RN have 2 institutions; AC, AL, AP, GO, MA, RR and TO have 1 institution; RO does not have any accredited institutions. UFC UFRN UFRN UFU UFES UFMG Õཨྰཿཨྰཿཤྩ 8 tཤྩ 34 28 Source: ANP | Prepared by: Ideies/Findes Note: A project can have more than one executing company. Data until 09/29/2021 Data collected on 10/25/2021 39. This reduction will come from the adap- tation of Mogai's 3D camera used in mining, for integrated use with other industrial asset management tools for industrial painting and corrosion monitoring. The proposed solution will assist in the diagnosis of corrosion or paint degradation from easy-to-use 3D cameras adapted to the oil rig environment.#3874 ESPÍRITO SANTO OIL & NATURAL GAS YEARBOOK | 2021 CAPÍTULO 4| RESEARCH, DEVELOPMENT AND INNOVATION 15 75 The small number of research units in Espírito Santo explains, to some extent, why only 90 proj- ects/programs were developed within the state, namely three possible reasons in particular: (i) The reduced number of pro- fessors, scholarship holders and laboratories present in these re- search units; (ii) The complexity and duration of projects and programs; ber of projects using this Clause is, consequently, increasing the number of registered research (iii) Faculty duties in other aca- units, as well as to continue ex- demic activities. panding the involvement of com- panies in pursuit of the resources under the Clause. These points, taken as a whole, reveal why the research units have limited time to receive the in- vestments under the RD&I Clause. One option to increase the num- BOX 2 - THE ROLE OF SENAI IN THE DEVELOPMENT OF INNOVATIVE PROJECTS The Technology Institutes work strongly in providing specialized technical services in metrology and consulting and developing solutions based on existing tech- nologies to create new processes and products, through the 62 units present in 17 Brazilian states. Espírito Santo has a Senai Institute of Technology in Operational Effi- ciency, which supports companies from Espírito Santo in the search for a process for improvement and technology transfer with custom- ized solutions for optimizing re- sources and reducing waste in the industry. The Institute has a portfo- lio of services focused on the fields of metrology, consulting, research and development and specialized technical services. Espírito Santo has a Senai Institute of Technology in Opera- tional Efficiency Table 8 - Fields of Operation of the Senai Institute of Technology in Operational Efficiency of Espírito Santo Areas of Operation Metrology Description Verification of performance and quality of products and processes. In addition to carrying out assess- ments, the institute acts as a liai- son between companies with the national network of laboratories for testing and calibration. • Services offered Mechanical tests Nondestructive testing SENAI PELO FUTURO DO TRABALHO 26 innovation institutes 62 innovation institutes The evolution of projects financed by ANP'S RD&I Clause is important for the development of the O&G in- dustry, standing as a fundamental promotion strategy for the expan- sion of the market and develop- ment of new technologies. The Na- tional Industrial Learning Service (SENAI), under the organization and management of the National Confederation of Industries (CNI) and Federations of Industries, is one of the five largest professional education complexes in the world and the largest in Latin America and can contribute to the advance- ment of projects and the techno- logical process of the industry. In addition to offering professional education (from initiation into tech- nological graduation and graduate courses), SENAI has 26 Innovation Institutes 40 and 62 Technology Institutes, which develop highly complex products and processes and offer technological services to the industry. Innovation Institutes are present in the states of Rio de Janeiro (4), Ba- hia (4), São Paulo (3), Minas Gerais (3), Santa Catarina (3), Rio Grande do Sul (2), Paraná (2), Pernambuco (1), Rio Grande do Norte (1), Mato Grosso do Sul (1), Amazonas (1) and Pará (1). The focus of these Institutes is applied research, de- velopment of new products and customized solutions, working from the pre-competitive phase of the innovative process to the final stages of development, when the new product is about to be manu- factured by the industry. Consulting Intelligent Systems Specialized Technical Services Work in diagnosis, technical as- sistance and solution of industrial problems is the main line of ac- tion of the institute. Consulting in the production process, custom- ized according to the demand of companies stands out. Technological development plays a fundamental role in gaining pro- ductivity and operational efficien- cy and is consolidated as a chal- lenge for industries. Standardized operational ser- vices based on systematized standards and procedures. These services focus on increas- ing the efficiency of production processes and products. ⚫ Lean manufacturing consulting Energy efficiency and alternative energy sources Implementation of cleaner production programs ⚫ Life cycle assessment Consultancy in planning and control of production processes Adjustment of machines for complying with standards Environmental licensing, auditing and program development Environmental Impact Study (EIA-Rima) • Implementation of ABNT Standards - ISO 14001, 17025 and 50001 • Process automation consulting O Consulting in Sensing and Digitization • Consulting in Process Simulation and Optimization . • Gamification and Distance Learning Platforms Instructional Design Virtual and Augmented Reality Project of Prototypes, Devices, and Products • Software w Platforms, IoT (Internet of Things) • Machine Learning / Artificial Intelligence ⚫ Data mining Modeling development Environmental diagnosis and inventories Cut map • Management plans for solid waste, liquid effluents and atmospher- ic emissions • Reverse logistics plans Effluent treatment project and water reuse plan Prototyping Computer simulation Source: Senai. Prepared by: Ideies / Findes 40. Learn more at: http://institutos.Senai.br/ 41. Learn more at: http://institutostecnologia.Senai.br/#3976 ESPÍRITO SANTO OIL & NATURAL GAS YEARBOOK | 2021 CAPÍTULO 4| RESEARCH, DEVELOPMENT AND INNOVATION Senai is authorized to execute projects with the resourc- es under the RD&I Clause as an execut- ing institution. 10 State Senai institutions developed projects with the resources of the RD&I Clause between 2016 and September 2021 73 projects were started with the resources of the RD&I clause through 17 Senai research units (which are the Innovation or Technol- ogy Institutes) Senai is authorized to execute projects with the resources under the RD&I Clause as an executing institution. To do so, Senai in each state needs to register Innovation Institutes or Technology Institutes as research units in the ANP. Cur- rently, Senai has 38 research units registered and suitable for projects development, using the resources provided by the RD&I Clause. These units are allocated among Brazilian states. Between 2016 and 2021, the Clause's resources were used for implementing 73 projects in 17 Se- nai research units (which are the Institutes of Innovation or Tech- nology). Twenty-two of these proj- ects were developed in partnership withexecuting companies and 51 were carried out individually by Se- nai institutes. These projects cov- ered the areas of supply, biofuels, oil exploration and production, nat- ural gas, regulation of the oil sector, and cross-cutting issues (such as safety and the environment). In March 2022, a project devel- oped in the 1st Industrial Entrepre- neurship Program by the Espírito Santo startup Dersalis in conjunc- tion with Shell won the internation- al Gartner Power of the Profession Supply Chain Award. The Dersa- lis-Shell partnership, brokered by Findeslab, took first place in the People Breakthrough of the year category, with the project "Use of the Smartwatch for the safety and care of employees". Chart 46 - Number of projects initiated/executed with the resources of the RD&I Clause by SENAI, per year 26 19 Figure 4 - Area and theme of the Projects - Senai AREA SUPPLY (6) BIOFUELS (7) EXPLORATION AND PRODUCTION (36) NATURAL GAS (3) REGULATION (1) TRANSVERSAL THEMES (20) Source: ANP | Prepared by: Ideies/Findes 1 7 11 9 ... 2016 2017 2018 2019 2020 2021 Source: ANP | Prepared by: Ideies/Findes THEME 1ST AND 2ND GENERATION PETROCHEMICALS (1) REFINING (5) ADVANCED BIOFUELS (2ND, 3RD, 4TH GENERATION (5) BIODIESEL (1) ENERGY FROM OTHER BIOMASS SOURCES (1) WELL ENGINEERING (6) EXPLORATION - PRE-SALT, DEEP WATERS, MATURE BASINS AND NEW EXPLORATORY FRONTIERS (14) PRODUCTION - PRE-SALT HORIZON, DEEP WATERS, MATURE BASINS AND NEW EXPLORATORY FRONTIERS (14) ADVANCED OIL RECOVERY (1) MOVING AND STORAGE (3) SECURITY AND ENVIROMENT (1) ECONOMIC ASPECTS OF INDUSTRY REGULARION (1) COMPLIANCE ASSESSMENT, MONITORING AND CONTROL (4) MATERIALS (13) SECURITY AND ENVIROMENT (3) In addition to Findeslab, the project also counted on the participation of Senai in the development of the device prototype. Three Senai In- stitutes were involved: the Senai Institute of Technology in Opera- tional Efficiency (IST-EO), located in Espírito Santo; the Senai Institute of Technology in Electronics and Automation; and the Senai Institute for Innovation in Advanced Man- ufacturing and Microfabrication, both located in São Paulo. These results show Senai's poten- tial to contribute to the innovation ecosystem in Brazil and to the de- velopment of new technologies for the Oil and Gas sector, contributing to it in the national and internation- al markets. In addition to being the biggest trainer of professionals for the Brazilian industry, Senai has enormous potential, as it is an im- portant link between the university and the industry. न 77#40CHAPTER 5 OPPORTUNITIES FOR ESPÍRITO SANTO Chapter 5 OPPORTUNITIES FOR ESPÍRITO SANTO The scenario for the next few years for the oil and gas sector will be marked by the drop in global investments and the maintenance of production in priority areas by the large oil companies. Notwith- standing, this new background requires greater adaptability and predictability of the concerned players. Espírito Santo will be im- pacted by the priority projects of the large oil companies and also by the new market of small and me- dium-sized companies operating in new areas of the industry. The opportunities can be summarized into four groups: i) Announced In- vestments ii) Permanent Offer iii) Petrobras Divestment Plan and iv) Decommissioning of facilities. 79 26.5% was the average annual drop in global investment flow according to the FDI Markets platform, reaching $536 billion 4.1% is the expected growth of the global economy for 2022 according to the World Bank projections 5.1. Announced investments According to the FDI Markets plat- form, between 2018 and 2020, the global investment flow recorded an average annual drop of 26.5%, reaching US$ 536 billion in 2020. The level recorded was the lowest in the historical series, which began in 2003. The unsatisfactory perfor- mance is largely explained by the outbreak of the new Coronavirus global pandemic in 2020, which postponed investment decisions on a global basis. An unfavorable macroeconomic scenario of the main economies in the world also contributes to a drop in invest- ments in traditional sectors such as oil and gas, coal, real estate, and the chemical sector. In the coming years, the trend is for the flow of global investments to re- turn to more substantial amounts. The basis for this statement lies in the projection of 4.3% growth of the global economy for 2022, signaled by the World Bank. According to the institution, the world will grow at a faster pace after the recession caused by the Covid-19 health cri- sis. Upon the advance of vaccina- tion against the disease, there will be a greater need for investments to return the level of global activity to the levels existing before the re- cession. The main sectors responsible for global investments in the period between 2018 and 2020 were the renewable energy sector (10.1%) and the oil and natural gas sector (9.3%). The oil and gas sector re- corded an average annual drop of 31.2% in the three years of analy- sis and, even with the expressive drop, it remained with a significant amount of investments in the glob- al scenario. In contrast, the renew- able energy sector recorded an average annual increase of 4.7% in the same period (chart 47). The main oil companies in the oil#4180 ESPÍRITO SANTO OIL & NATURAL GAS YEARBOOK | 2021 CHAPTER 5 OPPORTUNITIES FOR ESPÍRITO SANTO 81 87 The greater volume of investments in renewable energies is related to the growing concern of global leaders with the energy transition, aiming at reducing CO2 emissions and, consequently, miti- gating the effects of global warming. and gas industry have undergone significant changes in the compo- sition of their investments since the outbreak of the Covid-19 pandem- ic. Companies started prioritizing investment projects with higher re- turn rates, focusing on the planning of already consolidated oil and nat- ural gas exploration and production projects, which required a lower volume of invested capital. In this scenario, part of the indus- try's global investment capacity was absorbed by the renewable en- ergy sector. The greater volume of investments in renewable energies is related to the growing concern of global leaders with the energy tran- sition, aiming at reducing CO2 emis- sions and, consequently, mitigating the effects of global warming. state will receive a total of US$ 8.1 billion in investments in the oil and gas sector by 2025. In total, 7 proj- ects were identified in the State, mainly involving the companies Petrobras, Karavan Oil and Gas and Shell. The highlight is the Integrated Project of Parque das Baleia (IPB). The Parque das Baleias Integrated Project (IPB) intends to increase the oil and gas recovery factor by optimizing the current drainage net- work, with the interconnection of a new FPSO 42. In November 2021, a letter of intent was signed between Petrobras and the company Yinson for chartering and providing ser- vices for the new FPSO, which is US$ 8.1 billion expected to commence operations in investments are expected in 2024. Currently, the project is in- in the oil and natural gas sec- cluded in Petrobras' Strategic Plan tor in Espírito Santo by 2025 2022-2026 and has a total invest- ment of R$ 5.0 billion. Table 9 pres- ents the main projects identified by Ideies Investment Compass. Chart 47 - Investment in the oil industry worldwide (in billions of US$) 250 225 200 175 150 125 100 75 50 25 0 Oil & Gas Sector Worldwide Renewable Energies Sector Source: FDI Markets | Prepared by: Ideies/Findes Project Petrobras - Integrated of Parque das Baleias (IPB). Table 9 - Main investments announced in the Oil & Gas industry in Espírito Santo for the next 5 years Investor Sector Municipality Anchieta, Piúma, Itapemirim, Marataízes and Presidente kennedy Amount (mil- lions R$) Project Status Oil & Gas 5,000 Ongoing bidding Investment opportunity in areas Karavan Oil & Gas of exploration and production of Petrobras' Divestment Plan Oil & Gas São Mateus, Conceição da Barra and Jaguaré 1,000 In execution Shell Brasil Development and Production of the fields in the Southern Shore of Espírito Santo. Oil & Gas Anchieta, Piúma, Itapemirim, Marataízes and Presidente Kennedy 1,000 In execution PetroRio The Wahoo project contemplates the drilling of wells and the connec- tions between the wells and the Frade FPSO. Oil & Gas Presidente Kennedy 800 In execution ESGÁS Expanding the distribution net- worki in another 292 thousand meters and connecting over 96 thousand new consumers Oil & Gas Espírito Santo 260 Planning In execution 40 In execution 754 is the number of investment signals worldwide for the oil and natural gas industry According to the FDI Markets plat- form, there are currently 754 in- vestment signals worldwide for the oil and natural gas sector. Brazil is mentioned in 26 projects, 3.44% of the total. The projects that men- tion Brazil are mostly from new investment strategies or regarding expansions of already consolidat- ed projects. The capital invested come mainly from Spain, the Unit- ed Kingdom, and Norway. Brazil competes for receiving these in- vestments with countries such as India, Mexico, South Africa, and South American countries such as Peru, Argentina, Bolivia and Colombia. In Espírito Santo, according to the investment survey carried out by Ideies, it is estimated that the Imetame The company acquired from Petrobras the entirety of the inter- est in onshore fields of the Lagoa Parda Complex. Oil & Gas Linhares 40 40 ESGÁS Interconnection of the Linhares distribution network to the Cacimbas-Catu transportation pipeline for expanding the supply capacity to the municipality of Linhares. Oil & Gas Linhares 40 Total Source: IJSN, Petrobras, ESGÁS and Bandes | Prepared by: Bússola do Investimento - Ideies/Findes 42. The area of the park is formed by the Jubarte, Baleia Azul, Baleia Franca, parts, portions of Cachalote and Pirambu. 8,140#4282 ESPÍRITO SANTO OIL & NATURAL GAS YEARBOOK | 2021 CHAPTER 5| OPPORTUNITIES FOR ESPÍRITO SANTO 5.2. Permanent offer The Permanent Offer consisted, un- Throughout the national territory, AREAS IN OFFER IN til December 2021, of the continu- 1,068 exploratory blocks located in ESPÍRITO SANTO ous offer of exploratory blocks and areas with marginal accumulations located in any onshore or offshore basins, with the exception of blocks located in the pre-salt polygon, in strategic areas, or on the Continen- tal Shelf beyond the 200 nautical miles and the areas authorized for making up the 17th and 18th Bid- ding Rounds. In December 2021, the National Energy Policy Council (CNPE) au- thorized the agency to define and bid a Permanent Offer, under the CONCESSION REGIME 44 exploratory blocks: 21 blocks on the onshore portion 17 sedimentary basins are being of- fered under the concession regime for the Permanent Offer. In addition to these, 350 exploratory blocks are being studied for being offered under the concession regime in 6 Brazilian sedimentary basins and 10 areas with marginal accumula- tions in 5 onshore basins. The ar- eas under study will be available for the Permanent Offer soon after the Bid Submission: April 2022 environmental analysis is finalized and the public hearing, promoted by the ANP, is held. 23 blocks in the offshore portion SHARE REGIME Área de Turmalina Public Hearing: concession regime blocks in any In Espírito Santo, 44 exploratory March 2022 onshore or offshore basins, as well as to bid for fields returned or in the process of being returned. For ar- eas located in the pre-salt polygon or in strategic areas, the offer must blocks are available, 21 onshore and 23 offshore blocks. These ar- eas have received a low volume of drilling in the past and, therefore, are associated with a greater ex- AREAS UNDER be preceded by a specific determi- ploratory risk due to the scarcity nation by the CNPE. of information. According to the schedule released by the ANP, the STUDY IN In January 2022, the council autho- public session for submitting bids ESPÍRITO SANTO rized the bidding on 11 blocks in the Permanent Offer under the produc- tion sharing regime, approving the technical and economic parame- ters. Consequently, the Permanent Offer encompasses the concession and production sharing regimes. is scheduled for April 2022. Figures 7 and 8 show the areas on offer, on- shore and offshore, respectively. CONCESSION REGIME MARGINAL ACCUMU- LATIONS 6 onshore areas: Barra do Ipiranga Rio São Mateus Oeste Mariricu Oeste Nativo Oeste Jacupemba Rio Itaúnas Leste Figure 5- Onshore exploratory blocks offered in the Permanent Offer Source: ANP | Prepared by: Ideies/Findes 0 25 50 km Figure 6 Offshore exploratory blocks offered in the Permanent Offer 0 25 50 km Source: ANP | Prepared by: Ideies/Findes I Marginal Fields under study Fields in production Exploratory blocks under concession ⚫ UPGN Transportation Gas Pipeline Outflow Gas Pipeline I Blocos being Offered Fields in production Exploratory blocks under concession • UPGN Transportation Gas Pipeline Outflow Gas Pipeline 88 83#4384 ESPÍRITO SANTO OIL & NATURAL GAS YEARBOOK | 2021 CHAPTER 5 OPPORTUNITIES FOR ESPÍRITO SANTO 85 In addition to those, a total 6 ar- eas with marginal accumulations are under study in Espírito Santo. Among those: Barra do Ipiranga 43, Rio São Mateus Oeste, Mariricu Oeste, Nativo Oeste, Jacupemba and Rio Itaúnas Leste, both locat- ed between the municipalities of Conceição da Barra, São Mateus, Jaguaré and Linhares. These areas were under concession of Petro- bras and were returned to the ANP in 201944. The areas and the poten- tial of oil and natural gas reserves are detailed in figure 8. 5.3. Petrobras' Divestment Plan Since 2015, Petrobras began the process of selling a group of as- sets relative to the exploration and production of oil and natural gas. The company's Divestment Plan aims at reducing the company's debt and maximizing investments in assets with greater profitability, focused on operations, for exam- ple, in exploration and production of oil and natural gas in deep and ultra-deep waters. Figure 7 - Areas with marginal accumulations under study for Permanent Offer Rio Itaúnas Leste Volume 'in place' Oil: 0.27 million m3 Gas: 51.66 million m3 Rio São Mateus Oeste Volume 'in place' Oil: 0.27 million m3 Gas: 66.18 million m3 Mariricu Oeste Volume 'in place' Oil: 0.72 million m3 Gas: 19.84 million m3 Nativo Oeste Volume 'in place' Oil: 7.71 million m³ Gas: 131.14 million m3 Barra do Ipiranga e Rio Barra Seca Volume 'in place' Oil: 0.90 million m3 Gas: 3,300.55 million m3 Jacupemba Volume 'in place' Oil: 1.51 million m3 Gas: 70.47 million m3 0 25 50 km - *Volume in place is the estimated total amount of hydrocarbon present in the field. Source: ANP based on Petrobras reports | Prepared by: Ideies/Findes H Finally, 11 exploratory blocks locat- ed between the Campos and San- tos basins are being offered under the sharing regime for the Perma- nent Offer. These are: Turmalina, Jade, AGATA, Tupinambá, Água- Marinha, Esmeralda, Bumerangue, Itaimbezinho, Norte de Brava, Su- doeste de Sagitário and Cruzeiro do Sul. The Turmalina area borders | Marginal Fields under study Fields in production | Exploratory blocks under concession UPGN Transportation Gas Pipeline Outflow Gas Pipeline the State of Espírito Santo. To ob- tain additional substantiation on the pre-bidding Regulations and production contract drafts referring to the areas described above, ANP will hold a public hearing in March 2022, regarding the offer of these areas under the sharing regime for the Permanent Offer. 50 areas were offered in Espíri- to Santo, with 68.0% having their sale completed 13 offshore areas were offered in Espírito Santo, with 15.4% having their sale completed 37 onshore areas were offered in Espírito Santo, with 86.5% having their sale completed In total, 50 areas were offered in Espírito Santo with 68.0% of the assets sold. On offshore, 13 areas were offered with 15.4% of the as- sets sold and as for onshore, 37 areas were offered with 86.5% of the assets sold. Table 1 lists the assets and status of each project. Petrobras has already sold 32 fields and 3 exploratory blocks in Espírito Santo. Karavan O&G ac- quired 27 fields at Polo Cricaré. Imetame Energia acquired Polo Lagoa Parda, which has 3 fields, all in the northern portion of the State. Cowan Petróleo e Gás ac- quired Petrobras' stakes in the ES- T-506 and ES-T-516 exploratory blocks. Finally, 3R Petroleum ac- quired the Peroá cluster, compris- ing two fields (Cangoá and Peroá) and the exploratory block B-M-21, which houses the Malombe natu- ral gas discovery. Petrobras is negotiating with the Seacrest Capital Group the sale of Fazenda Alegre, Cancã, Cancã Leste, Fazenda São Rafael and Fazenda Santa Luzia fields (all in production). In addition to these, the company is negotiating with BW Offshore the sale of its stakes in Polo Golfinho and in the ES-M- 525 block (BM-ES-23). As for the binding phase, there are seven areas. Among them, Polo Camarupim, formed by the Ca- 43. The Rio Barra Seca field was incorporated into Barra do Ipiranga. 44. In 2019, the ANP Board of Directors determined, through Board Resolu- tion 0254/2019, the termination of the concession process for 8 Petrobras fields, 7 of which are located in Espírito Santo Basin. The recovery of these marupim and Camarupim Norte fields. The offer contains the full transfer of operations, including all existing wells and facilities. The area has 10 wells drilled and 2 producing wells. The volume of the field corresponds to 9.1 billion cubic meters (Mm³) of natural gas and 9.5 million cubic meters (Mm³) of oil, according to 2015 estimates. The Camarupim Norte field has 7 wells drilled and 1 well in production. Petrobras' participation in 5 ex- ploratory blocks is also for sale. The ES-M-596, ES-M-598, ES- M-671, ES-M-673 and ES-M-743 blocks have between 40% and 50% interest held by Petrobras areas by the agency took place because Petrobras did not resume produc- tion, which had been stopped for more than six months, nor transferred the rights of these fields within the period determined by the ANP notification (twelve months).#4486 ESPÍRITO SANTO OIL & NATURAL GAS YEARBOOK | 2021 CHAPTER 5 OPPORTUNITIES FOR ESPÍRITO SANTO and the partners Equinor, Total and Enauta hold between 20% and 50%. In the opportunity dis- closure Teaser, Petrobras states that these areas have the poten- tial to prove significant volumes of oil and establish a position in a new exploratory frontier in both the pre-salt and post-salt layers. Catuá field, located in the deep waters of the Campos Basin. The area, discovered by Petrobras in 2003, has four wells drilled, with the identification of an oil reser- voir. According to Petrobras, there are two exploratory opportunities (Cobra D'Água and Catuá Norte), which represent possible new ac- cumulations in the reservoir. divestment plan is important be- cause it encourages the arrival of new oil and natural gas explora- tion and production companies in Espírito Santo. It is expected that this movement can boost future production, as well as the great- er demand for specialized goods and services in the sector's sup- ply chain. Petrobras' divestment plan is important because: 1. It encourages the entry of new oil and natural gas exploration and production companies in Espírito Santo. 2. This trend can boost future production, as well as the greater demand for specialized goods and services in the industry's supply chain. Recently, the company also an- nounced the binding phase of the It is worth noting that Petrobras' Table 10-areas offered by Petrobras in Espírito Santo Project Location Quantity of areas Bordering Municipality Sale of interest in the fields of Peroá, Cangoȧ and of block ES-M-414 (BM-ES-21). Offshore 2 Project Status Linhares Partner Concluded 3R Petroleum Sale of Petrobras' interest in Polo Golfinho and block ES- M-525 (BM-ES-23) Offshore 3 Linhares Binding Proposal BW Offshore Sale of Petrobras interest in Polo Camarupim Offshore 2 Linhares Binding Proposal Potential1 Sale of area ES-M-596 (exploratory area) Offshore 1 Vitória Binding Proposal Potential¹ Sale of area ES-M-598 (exploratory area) Offshore 1 Vitória Binding Proposal Potential¹ Sale of area ES-M-671 (exploratory area) Offshore 1 Vitória Binding Proposal Potential¹ Sale of area ES-M-673 (exploratory area) Sale of area ES-M-743 (exploratory area) Sale of Petrobras' interest in the Catuá field Offshore 1 Vitória Binding Proposal Potential¹ Offshore 1 Vitória Binding Proposal Potential¹ Offshore 1 Anchieta Binding Proposal Potential¹ Sale of 50% interest in block ES-T-506 Onshore 1 Linhares Concluded Cowan Petróleo e Gás Sale of 50% interest in block EST-516 Onshore 1 Linhares Concluded Cowan Petróleo e Gás Polo Cricaré Polo Lagoa Parda Campo Cancã Campo Cancã Leste Campo Fazenda Alegre Onshore 27 São Mateus, Conceição da Barra and Jaguaré Concluded Karavan Oil Onshore 3 Linhares Concluded Imetame Onshore 1 Espírito Santo Binding Proposal Seacrest Capital Group Onshore 1 Espírito Santo Binding Proposal Seacrest Capital Group Onshore 1 Espírito Santo Binding Proposal Seacrest Capital Group Campo Fazenda São Rafael Campo Fazenda Santa Luzia Onshore 1 Espírito Santo Binding Proposal Seacrest Capital Group Onshore 1 Espírito Santo Binding Proposal Seacrest Capital Group 1 in the process of sale and with partners still not announced Source: Petrobras and Portal Petróleo Hoje | Prepared by: Ideies/Findes 80 87#4588 ESPÍRITO SANTO OIL & NATURAL GAS YEARBOOK | 2021 CHAPTER 5 OPPORTUNITIES FOR ESPÍRITO SANTO 89 5.4. Decommissioning of facilities The decommissioning of facili- ties 45 is the safe destination for oil and natural gas exploration and production structures after the end of their production phase. In the facilities when all options for economically and environmentally viable development of the well in question have been considered. 102 proposals for Facility De- commissioning Program (PDI) 71 have been approved: other words, it occurs at the end As of March 2021, ANP had 102 of a field's useful life and, conse- quently, it leads to: the removal of its facilities; the drawing up of wells; the proper destination of materials, waste and tailings; and the environmental recovery of the area. It is worth noting that the ANP only approves the definitive interruption of the operation of proposals for the Facility Decom- 44 missioning Program (PDI) in Brazil, 71 of which were approved (44 on- shore and 27 offshore). In addition to those, another 2 are under anal- ysis, 6 are awaiting a response, 12 are in interrupted (or stopped) and 11 have been closed. in the onshore environment in the offshore 27 environment Another 2 are under analy- sis, 6 are awaiting a re- sponse, 12 are stayed (or interrupted) and 11 have been concluded Chart 48 - Distribution of Facility Decommissioning Programs (PDI) approved by ANP, by Basin 3277777 3 6 71 7 12 Fonte: ANP | Elaboração: Ideies/Findes 19 14 13 basins had a total of 71 PDIs approved by ANP 19 projects were approved in the Espírito Santo Basin In total, thirteen basins had a to- tal of 71 PDI approved by ANP. Of that total, 19 plans were located in the Espírito Santo Basin, 14 in Campos Basin, 12 in Potiguar Ba- sin and 26 in another ten basins (Chart 48). In the Espírito Santo basin, 18 projects were approved for onshore wells and only 1 proj- ect for offshore wells (Cação). Of the total, 17 projects are fields owned by Petrobras, 1 project owned by Petrosyenergy and 1 project owned by Vipetro. Table 11 - List of Decommissioning Programs (PDI) of the Espírito Santo Basin, approved and under analysis PDI Onshore 18 I projects Mariricu Oeste Basin Field Environment Company Albatroz Espírito Santo Albatroz Onshore Petrisyenergy Barra do Ipiranga Espírito Santo Barra do Ipiranga Onshore Petrobras Cação Espírito Santo Cação Offshore Petrobras Corruíra Espírito Santo Corruíra Onshore Petrobras Jacupemba Espírito Santo Jacupemba Onshore Petrobras Lagoa do Doutor Espírito Santo Lagoa do Doutor Onshore Vipetro Offshore project Lagoa Parda Sul Espírito Santo Lagoa Parda Sul Onshore Petrobras Espírito Santo Mariricu Oeste Onshore Petrobras Mosquito Espírito Santo Mosquito Onshore Petrobras Espírito Santo Campos Potiguar Santos Recôncavo Sergipe-Alagoas Alagoas Tucano Sul Mucuri Parnaíba Sergipe Amazonas Camamu R$ 2.4 billion is the total investment planned for the decommis- sioning of 680 wells in the years 2022 through 2026 Rio Mariricu Sul Mosquito Norte Espírito Santo Mosquito Norte Onshore Petrobras Nativo Oeste Espírito Santo Nativo Oeste Onshore Petrobras Rio Barra Seca Rio Doce Espírito Santo Espírito Santo Rio Barra Seca Onshore Petrobras Rio Doce Onshore Petrobras Rio Ibiribas Executivo Espírito Santo Rio Ibiribas Onshore Petrobras Rio Itaunas Leste Espírito Santo Rio Itaunas Leste Onshore Petrobras Rio Mariricu Espírito Santo Rio Mariricu Onshore Petrobras Espírito Santo Mariricu Sul Onshore Petrobras Rio Preto Espírito Santo Rio Preto Onshore Petrobras Rio São Mateus Oeste Espírito Santo Rio São Mateus Oeste Onshore Petrobras Source: ANP | Prepared by: Ideies/Findes 45. Resolution 817 of April 24, 2020 was an im- portant milestone for the national oil industry as it modernized the regulation that governs decommis- sioning of E&P facilities, the procedure for returning areas to the ANP and the disposal and reversal of assets. This precaution in the legislation aims to maximize the recovery of reservoirs and avoid pre- mature decommissioning of production facilities.#4690 90 ESPÍRITO SANTO OIL & NATURAL GAS YEARBOOK | 2021 CHAPTER 5| OPPORTUNITIES FOR ESPÍRITO SANTO 91 17 In the State of Espírito Santo, the decommissioning of 680 wells will generate R$ 2.43 billion in investment in the years 2022 to 2026, R$ 781.2 million of which in the Campos Basin and another 1.64 billion in the Espírito Santo Basin. This total amount will be invested in permanent abandon- ment activities (59.9%), removal of lines (23.3%), removal of fa- cilities associated with Onshore Production Units (4.5%), environ- mental recovery (5.2%) and UEP demobilization (6.9%). Of this total investment in the State of Espírito Santo in the pe- riod, 2022 to 2026, R$ 546.48 million will be generated by the decommissioning of 661 on- shore wells. And another R$ 1.88 by 19 offshore wells. Consequently, there are opportu- nities in thirteen basins for sup- plier companies to operate in the decommissioning of facilities, which is the final stage of the oil and natural gas chain. It is worth noting that this process can still be a major challenge for the oil and natural gas production indus- try due to the need of complying with regulations, expanding tech- nical training and developing the service chain. Chart 49 Investments Projected for PDI Facilities Decommissioning Programs in Brazil (in millions R$) - 2021-2025 20,000 15,000 17,198.2 831.1 Figure 8- Inventory of offshore facilities with approved PDI close to the State of Espírito Santo (2021-2026) Minas Gerais Rio de Janeiro Espírito Santo Vitória Bahia Plataformas Fixas PCA-01 PCA-02 PCA-03* Campo: Cação FPSO Capixaba FPSO Cidade do Rio de Janeiro* Campo: Espadarte FPSO Marlim Azuk* Campo: Marlim Azul P-27* TIL Campo: Voador P-32 Campo: Viola Previsão: 2022 FPSO Cidade Rio das Ostras* Campo: Tartaruga Verde FPSP Fluminense Campo: Pijupirá e Salema Poços: 22 同 FPSO Brasil* Campo: Roncador P-12* Campo: Jubarte Poços: 2 Campo: Linguado, Badejo, Trilha, Bicudo e Enchova Oeste P-07* Campo: Bicudo, Pampoe Enchova Oeste P-15* Campo: Piraúna Espírito Santo ● Campos * Decommissioned Units in 2021 10,000 10,181.1 307.2 16,367 9,636.1 253.8 8,053.9 1394.7 9,874 6,030.4 639.3 5,000 9,382 7,659 5,391 0 2022 2023 2024 2025 2026 Other Brazilian States State of Espírito Santo Total in Brazil Source: ANP | Prepared by: Ideies/Findes Previsão: 2022 Note: The other two facilities of the Campos basin with approved PDI and which are not on the map were FPSO OSX-1 (Tubarão Azul Field) and FPSO Polvo (Polvo Field), both decommissioned in 2021. Source: ANP | Prepared by: Ideies/Findes#47GLOSSARY GLOSSARY A Adjacent pioneer exploratory well: well used for test- ing the occurrence of oil or natural gas in an area adja- cent to a discovery. Area Return Notification: written communication is- sued by the Concession Holder to ANP relative to the return of areas, in the circumstances governed by the Contract, which contains the list of Reversible Assets existing in the portion to be returned and the outlining of the polygon of the areas to be retained. B Barrel of equivalent oil (boe): barrel of equivalent oil (1,000 m³ of gas ≈ 6.28981 bbl) - measure that sums the volumes of oil and gas production Barrel of oil per day (bpd): unit used to reference the daily production of barrels of oil. Bidding rounds: a process held by the ANP for the pur- pose of having an auction between companies and/or joint-ventures interested in acquiring exploratory areas on concession or sharing basis. Brent: oil extracted in the North Sea and traded on the London Stock Exchange, its quotation is an interna- tional reference for the price of oil. C Closed well: a completed well that has already started production or injection operations, but which is closed, awaiting normalization of surface conditions, addition- al studies for decision making, or intervention with a probe for reassessment, re-completion, restoration, abandonment, among other purposes. Concession Holder: a company incorporated under Brazilian law, with headquarters and management in Brazil, with which the ANP enters into a concession contract for the exploration and production of oil or natural gas in a sedimentary basin located in the na- tional territory. Concession: a modality of assignment of an econom- ic activity by the government, usually through a bidding process, to an economic agent that proves the capaci- ty to perform it, at its own risk and for a predetermined period. In Brazil, the administrative contract for the delegation is made by the ANP, which grants compa- nies the right to carry out exploration and production activities of oil and natural gas in the Brazilian territory. D Declaration of commerciality: written notice from the concession holder to the ANP declaring a deposit as a commercial discovery in the concession area. Declarations of hydrocarbon traces: the concession contracts set the terms and work programs for ex- ploration and production activities. Under these con- tracts, the concession holder is required to notify the ANP of any discovery of hydrocarbons or other mineral resources within the concession area within 72 hours after the occurrence. Decommissioning: a set of legal actions, techniques and engineering procedures applied in an integrated way to a Pipeline, for ensuring its decommissioning meets the conditions relative to safety, environmental preservation, reliability and traceability of information and documents. Deep water: oceanic waters located at any distance from the coast with a seabed depth of 300-1,500 me- ters. Deeper prospection exploratory well: well used for testing the occurrence of accumulations or deeper fa- vorable geological conditions in a given area. Destroyed well: permanently abandoned well in which all equipment related to the wellhead assembly was re- moved and the surface and the casing at the bottom of the preboring was cut. Development plan: the instrument for planning devel- opment and production, covering the entire life cycle of the oil field. It describes the activities and investments that will be made/carried out, whereby all other me- dium and short-term plans will have to be consistent with it. E Exploration phase: this phase has the goal of discov- ering and surveying oil and/or natural gas deposits. Ex- ploratory activities involve the acquisition of seismic, gravimetric, magnetometric, geochemical data, drill- ing, and evaluation of wells, among others, and which must comply with the Minimum Exploration Program (PEM) agreed with the ANP. Exploratory Block: geographically delimited areas re- ferring to a sedimentary basin, where oil and natural gas exploration activities are carried out. Exploratory extension well: a well used for limiting the accumulation of oil or natural gas and/or to investigate contact between fluids, communication between re- gions of a reservoir, and properties that allow charac- terizing it. Exploratory injection well: well used for injecting flu- ids into the reservoir to improve the recovery of hydro- carbons. Injecting well for storage: well operates as a fluid in- jector for the storage of natural gas. Injecting well: well operates as a fluid injector to im- prove the recovery of hydrocarbons from the reservoir. M Marginal fields: inactive areas in which there was no production of oil and/or natural gas or production was interrupted due to lack of economic interest. Mature Basin: sedimentary oil basin whose produc- tion is already in decline. Exploratory production well: well used for draining Mature fields: oil fields whose production is already one or more deposits from a field. Exploratory stratigraphic well: well used for learning the stratigraphic column and obtaining other surface's geological information in a basin or region that is little explored; F Federal Petroleum, Natural Gas and Biofuels Agency (ANP): regulatory body for the oil, natural gas, and bio- fuels markets in Brazil, except for regulation of natural gas distribution, which is governed on a state level. Financial Compensation: amount owed to States, Mu- nicipalities, and the Federal Government for the use of natural resources, since these entities are affected by the exploration and production activity. G Government Shares: payments to be made by the holders of concessions of oil and natural gas explora- tion and production activities, pursuant to Articles 45 to 51 of Law 9.478, of 1997, and of Decree 2.705, of 1998. H Hydrocarbon: A chemical compound composed sole- in decline. Minimum Exploratory Program (PEM): exploratory activities to be necessarily carried out by the conces- sion holder during the exploration phase, defined by the ANP, according to criteria for surveying the areas to be explored. Mining: a set of coordinated operations for extracting oil or natural gas from a deposit and preparing for its handling/transportation. 0 Offshore: maritime environment and land-sea transi- tion zone or area located in the sea. Oil byproducts: products resulting from the transfor- mation of petroleum. Oil fields: area producing oil or natural gas, from a con- tinuous reservoir or more than one reservoir, at vari- able depths, encompassing installations and equip- ment intended for production. (Source: Law 9.478, of 8/6/1997. Oil production chain: a group of activities in the pro- duction chain, from the extraction of crude oil to the last phase of adding value in the sector, segmented into four branches: exploration, refining, petrochemical ly by carbon and hydrogen atoms. Oil and natural gas industry, and transformation industry. are examples of hydrocarbons. Oil Production: a set of coordinated operations for ex- tracting oil or natural gas from a deposit and preparing its handling, according to the definitions outlined in#48GLOSSÁRIO item XVI of art. 6 of Law 9.478 of 1997, or even the vol- ume of oil or natural gas extracted during production, as one may see in the text, as applicable. Oil refinement: activity carried out by an industrial unit that uses as raw material the oil originated from an extraction and production unit of a field and which, through processes including heating, fractioning, pres- sure, vacuum, and reheating in the presence of cata- lysts, creates oil byproducts from the lightest ones (refinery gas, LNG, Petroleum Nafta) to heavier ones (bunker, fuel oil), in addition to solid fractions, such as petroleum coke and asphalt residue. Oil Well: drilling on the surface used for producing oil and/or natural gas. Oil: any and all liquid hydrocarbons in their natural state, such as crude oil and condensate, whose ex- ploration and production is governed by Law 9,478, of 8/6/1997. Onerous assignment: a model of assignment of an exploratory area to Petrobras - bilateral negotiation, in consideration for payment of a certain amount, which was regulated by Law 12,276, of June 30, 2010, limiting exploration to up to 5 billion boe. Onshore: terrestrial environment or area located on- shore. P Payment for area occupation or retention: amount paid by concession holders to land owners where oil and natural gas exploration and production activities are carried out. This payment is made in two ways: (i) on an annual basis, through unitary amounts in Reais per square kilometer of the concession area outliner in the Bidding Regulations and the contract, succes- sively applicable to the exploration, development, and production phases. The determination of this amount is made by the ANP and takes into account the geolog- ical characteristics and the location of the sedimen- tary basin; (ii) on a monthly basis, by multiplying the equivalent of 1% of the total volume of oil and natural gas production in the field, during the reference month by their respective reference prices. Permanent offer: continuous offer of fields returned (or in the process of being returned) and exploratory blocks offered in previous bids and not auctioned or returned to the agency (Article 4 of CNPE Resolution 17, 06/08/2017). Permanently abandoned well: well for which there is no interest in future resumption and operations were carried out to establish redundant sets of permanent barriers. Petroleum Coke: fuel derived from coal agglomeration and consisting of mineral matter and carbon fused. It is a solid and cohesive residue left over from the de- structive distillation of coal, oil, or other carbonaceous residues and contains mainly carbon. Petroleum consumption: an activity that consists of the use of crude petroleum oil to manufacture petro- leum products. Pioneer exploratory well: well used for testing the oc- currence of oil or natural gas in one or more objectives of a geological prospect not yet drilled. Pre-salt layer: a subsoil region formed by a vertical prism of undetermined depth, with a polygonal surface defined by the geographic coordinates of its vertices detailed in the Appendix of Law 12.351/2010, as well as other regions that may be outlined by the Execu- tive Branch, according to the evolution of geological knowledge. Producing well: well operating as a hydrocarbon producer. Production Sharing: oil and natural gas exploration and production model, which provides not only the payment of royalties, but also the physical division of hydrocarbon production, discounting the cost incurred in exploration and production activities. It is currently governed by Law 12,351, of 12/22/2010. Production stage: The stage where the accumu- lations of oil and/or natural gas are discovered and which have had their commercial viability proven and originate in a producing field, developed, and put into production to supply the market. Production Unit (Exploration and Production): a group of facilities intended to promote the separation, treatment, storage and flow of fluids produced and moved in an oil, and natural gas field. Proven reserves: A quantity of Oil or Natural Gas that the analysis of geoscience data and engineering indi- cates with reasonable certainty that it is an economi- cally viable well, and for which investments are com- mercially recoverable. لل R Repetro-Eligible: goods under a special export and im- port customs regime, which are intended for research activities and mining of oil and natural gas deposits, with a suspension of customs duties. Returned fields: area returned to the ANP through the Area Return Notice. The act of returning the field im- plies the interruption of all exploration activities on the returned portion, except for the activities concerning the decommissioning of facilities and environmental recovery. Royalties: a financial compensation owed to the Fed- eral Government, States, and Municipalities, by the holders of concessions for exploration and production of oil or natural gas to be paid on a monthly basis ac- cording to the volume of production in the month, in a given field, right from the start of production; S Sedimentary Basin: depression of the earth's crust where sedimentary rocks accumulate and which may store oil or gas, whether or not associated. Shallow waters: oceanic waters located at any distance from the coast with a seabed depth of 0-300 meters. Shallower prospection exploratory well: well used for testing the occurrence of accumulations or shallower favorable geological conditions in a given area Signing bonus: resources offered by the winning bid- der in the proposal to obtain the oil or natural gas ex- ploration concession, which cannot be lower than the minimum value set in the Bidding Notice/Regulations. Part of these resources are destined for the Federal Government and another part for the ANP; Special Share: this is an extraordinary financial com- pensation owed to the Federal Government, States, and Municipalities, following ANP Resolution 12/2014 by holders of concessions for exploration and produc- tion of oil or natural gas, in cases of large production volume or high profitability. Special well: well used for specific objectives that do not fit the previously defined purposes. Storage Well: well intended to allow natural gas stor- age operations, including injection, withdrawal, and monitoring. T Temporarily abandoned well with monitoring: well which there is interest in future resumption of opera- tions and for which work has been carried out to estab- lish redundant sets of barriers, which must be periodi- cally monitored and/or verified. Ultra-deep waters: oceanic waters located at any dis- tance from the coast with a seabed depth greater than 1,500 meters. Upstream: a segment of the petroleum industry that includes the activities of exploration, development, production, and transportation of oil to refineries. W Well operating for disposal: a well operating for dis- posal of fluids produced by other wells or disposal of various effluents generated in exploration and produc- tion activities, in areas that do not produce at that time. Well producing and injecting: well operating simulta- neously producing hydrocarbons and injecting fluids (at different intervals). Well temporarily abandoned without monitoring: well which there is interest in the future resumption of op- erations and for which work has been carried out to establish joint sets of barriers not monitored and/or verified. Well under observation: instrumented well used for monitoring pressures in a reservoir producing hydro- carbons or storing natural gas. Well withdrawing stored natural gas: well operating to withdraw natural gas from a storage reservoir. WTI (West Texas Intermediate): oil extracted from the Permiano Basin, in West Texas and East of New Mexi- co, traded on the New York Stock Exchange. Its quote serves as an international reference for the price of oil.#49APPENDIX Complementation of the list of the National Classification of Economic Activities (CNAES) of the Oil and Natural Gas industry chain of production The complementation of the list of the National Classification of Eco- nomic Activities (CNAES) of the pro- ductive chain of the Oil and Natural Gas industry used in this yearbook was prepared based on two meth- ods. The first was the conversion of the Mercosur Common Nomen- clature (NCM) of exported products used in the "External Sector" section of this Yearbook for CNAES46. The second was the mapping through a consultation of the "Manual on National Classification of Eco- nomic Activities version 2.0"47 which, in most cases, describes which CNAE activities "x" supplies or provides services. Table 12 - List of the National Classification of Economic Activities (CNAES) of the oil and natural gas industry chain of production References ANP. Agência Nacional de Petróleo, Gás Natural e Biocombustíveis. Anuário Estatístico Brasileiro Do Petróleo, Gás Natural e Biocombustíveis 2021. Rio de Janeiro: ANP, 2021. Dados Abertos Pesquisa e Desenvolvimento e Inovação (PD&I). Disponível em: <https:// www.gov.br/anp/pt-br/centrais-de-conteudo/dados-abertos/dados-abertos-pesquisa-e-desenvolvimento-e-in- ovacao-pd-i>. Acesso em: dezembro de 2021. Declaração de comercialidade. Disponível em: <https://www.gov.br/anp/pt-br/assuntos/ex- ploracao-e-producao-de-oleo-e-gas/gestao-de-contratos-de-e-p/orientacoes-aos-concessionarios-e-contrat- ados/declaracao-de-comercialidade CNAE CNAE Description 6000 Extraction of oil and natural gas Link of the O&G chain of production E&P 9106 Oil and natural gas extraction support activities E&P 19217 Manufacturing of oil refinement products Oil byproducts 19225 Manufacturing of oil byproducts, except for refinement products Oil byproducts 20215 Manufacturing of basic petrochemical products Petrochemicals 20223 Manufacturing of intermediaries for plasticizers, resins and fibers Petrochemicals 20291 Manufacturing of chemicals and organic products not previously specified Petrochemicals 20312 Manufacturing of thermoplastic resins Petrochemicals 20321 Manufacturing of thermosetting resins Petrochemicals 20339 Manufacturing of elastomers Petrochemicals 35204 Production of gas Supply 46818 Wholesale of solid, liquid and gas fuels, except for natural gas and LPG Supply 46826 Wholesale of liquefied petroleum gas (LPG) Supply 20941 Manufacturing of catalysts Chain of Supply 25110 Manufacturing of metal structures Chain of Supply 28291 Manufacturing of machines and equipment for general use not previously specified Chain of Supply 28518 Manufacturing of machines and equipment for prospection and extraction of oil Chain of Supply 28691 Manufacturing of machines and equipment for specific industrial use not pre- Chain of Supply viously specified 30113 Construction of vessels and floating structures Chain of Supply Chain of Supply Chain of Supply Descomissionamento de instalações. Disponível em: <https://www.gov.br/anp/pt-br/assun- tos/exploracao-e-producao-de-oleo-e-gas/seguranca-operacional-e-meio-ambiente/descomissionamen- to-de-instalacoes>. Acesso em: março de 2022. Edital de licitações de oferta permanente. Versão nº 02.02. [outorga de contratos de concessão para exploração ou reabilitação e produção de petróleo e gás natural]. ANP - agência nacional do petróleo, gás natural e biocombustíveis. Rio de Janeiro, 30 de julho de 2021. Indícios de hidrocarbonetos. Disponível em: <https://cpl.anp.gov.br/anp-cpl-web/public/sigep/ consulta-hidrocarbonetos-constatados/consulta.xhtml>. Acesso em: março de 2022. Investimentos em PD&I. Disponível em: <http://www.anp.gov.br/pesquisa-desenvolvimen- to-e-inovacao/investimentos-em-p-d-i>. Acesso em: dezembro de 2021. Oferta Permanente. Disponível em: <https://www.gov.br/anp/pt-br/rodadas-anp/oferta-perma- nente>. Acesso em: março de 2022. Projetos de PD&I. Disponível em: <https://www.gov.br/anp/pt-br/assuntos/pesquisa-desen- volvimento-e-inovacao/investimentos-em-pd-i/novo-projetos-de-pd-i>. Acesso em: dezembro de 2021. Resolução nº 03/2005. Estabelece definições, diretrizes e normas para a aplicação dos re- cursos a que se referem às Cláusulas de Investimento em Pesquisa, Desenvolvimento e Inovação (PD&I). Dis- ponível em: <https://atosoficiais.com.br/anp/resolucao-n-33-2005?origin=instituicao&q=33/2005>. Acesso em: dezembro 2021. Fonte laborbandealsantives relative to architecture and engineering 77390 Rental of machines and equipment not previously specified Source and preparation: Ideies/Findes 46. IBGE publishes a table for converting NCM 47. You can access the document at: https:// into CNAE at: https://concla.ibge.gov.br/classifi- biblioteca.ibge.gov.br/visualizacao/livros/ cacoes/correspondencias.html liv36932.pdf Resolução nº 50/2015. Estabelece definições, diretrizes e normas para a aplicação dos recur- sos a que se referem às Cláusulas de Investimento em Pesquisa, Desenvolvimento e Inovação (PD&I). Disponível em: <https://atosoficiais.com.br/anp/resolucao-n-50-2015?origin=instituicao>. Acesso em: dezembro 2021. REFERENCES#50REFERENCES Resolução n° 799/2019. Estabelece as normas para a aplicação de recursos a que se referem as cláusulas de pesquisa, desenvolvimento e inovação (P, D&I). Disponível em: <https://atosoficiais.com.br/anp/ resolucao-n-50-2015?origin=instituicao>. Acesso em: dezembro 2021. Resolução n° 866/2022. Estabelece as normas para a aplicação de recursos a que se refer- em as cláusulas de pesquisa, desenvolvimento e inovação (P,D&I). Disponível em: <https://atosoficiais.com. br/anp/resolucao-n-866-2022-altera-o-regulamento-tecnico-anp-no-3-de-2015-aprovado-pela-resolucao-anp- no-50-de-25-de-novembro-de-2015-a-qual-estabelece-as-normas-para-a-aplicacao-de-recursos-a-que-se- referem-as-clausulas-de-pesquisa-desenvolvimento-e-inovacao-p-d-i-presentes-nos-contratos-para-explo- racao-desenvolvimento-e-producao-de-petroleo-e-gas-e-da-outras-providencias?origin=instituicao>. Acesso em: dezembro 2021. Royalties. Disponível em: <https://www.gov.br/anp/pt-br/assuntos/royalties-e-outras-partici- pacoes/royalties>. Acesso em: novembro de 2021. Participações governamentais consolidadas. Disponível em: < https://www.gov.br/anp/pt-br/ assuntos/royalties-e-outras-participacoes/participacoes-governamentais-consolidadas>. Acesso em: novem- bro de 2021. Preço mínimo do petróleo. Disponível em: <https://www.gov.br/anp/pt-br/assuntos/royal- ties-e-outras-participacoes/preco-minimo-do-petroleo>. Acesso em: novembro de 2021. . Proprietários de Terra. Disponível em: <https://www.gov.br/anp/pt-br/assuntos/royalties-e-out- ras-participacoes/proprietarios-de-terra>. Acesso em: novembro de 2021. . Participação Especial. Disponível em: <https://www.gov.br/anp/pt-br/assuntos/royalties-e-out- ras-participacoes/participacao-especial>. Acesso em: novembro de 2021. Painel Dinâmico Descomissionamento de Instalações e Exploração e Produção. Disponível em: <https://www.gov.br/anp/pt-br/assuntos/royalties-e-outras-participacoes/participacao-especial>. Acesso em: novembro de 2021. BP. Statistical Review of World Energy. Disponível em: <https://www.bp.com/content/dam/bp/business-sites/ en/global/corporate/pdfs/energy-economics/statistical-review/bp-stats-review-2020-full-report.pdf>. Acesso em: dezembro de 2021. BRASIL. Lei nº 9.478 de 6 de agosto de 1997. Dispõe sobre a política energética nacional, as atividades rel- ativas ao monopólio do petróleo, institui o Conselho Nacional de Política Energética e a Agência Nacional do Petróleo e dá outras providências. Brasília, 6 de agosto de 1997. Disponível em: >http://www.planalto.gov.br/ ccivil 03/LEIS/L9478.htm>. Acesso em: outubro de 2021. FDI MARKETS. Total FDI Projects and Capex. London, United Kingdom, 2021. INSTITUTO DE DESENVOLVIMENTO EDUCACIONAL E INDUSTRIAL DO ESPÍRITO SANTO - IDEIES. Bússola do Investimento. Vitória, Espírito Santo. - IDEIES. Exercício INSTITUTO DE DESENVOLVIMENTO EDUCACIONAL E INDUSTRIAL DO ESPÍRITO SANTO proposto para a projeção da produção de petróleo e gás natural no espírito santo. N° 01/2022. INSTITUTO DE DESENVOLVIMENTO EDUCACIONAL E INDUSTRIAL DO ESPÍRITO SANTO - IDEIES. Gás natu- ral desafios e oportunidades para o Espírito Santo. N° 01/2020. MIDC - Ministério da Indústria, Comércio Exterior e Serviços. Comex Stata. Disponível em: <http://comexstat. mdic.gov.br/pt/home>. Acesso em: dezembro de 2021. MT-Ministério do Trabalho. Relação Anual de Informações Sociais (Rais). Distrito Federal, 2019. Petrobras Conexões para Inovação 2021. Sebrae, Brasília, 16 de jun. de 2021. Disponível em: <https://www. sebrae.com.br/sites/PortalSebrae/petrobras-conexoes-para-inovacao-2021,6de7248aeb51a710VgnVCM- 100000d701210a RCRD>. Acesso em: novembro de 2021. PETROBRAS. Desempenho no 3º trimestre de 2021. 29 de outubro de 2021. Disponível em <file://find- es-fs01/IDEIES/Anu%C3%A1rio%20do%20Petr%C3%B3leo%20-%202021/4.%20Refer%C3%AAncia/Web- cast-2021-3T-Portugues%20(2).pdf>. Acesso em: dezembro de 2021. PETROBRAS. Petrobras Plano Estratégico 2022-2026. Investimento com Responsabilidade. 30 de novembro de 2021. Disponível em <https://www.investidorpetrobras.com.br/apresentacoes-relatorios-e-eventos/apre- sentacoes/>. Acesso em: dezembro de 2021. Repsol Sinipec Brasil lança desafio de digitalização. Repsol Sinopec Brasil, Rio de Janeiro, 01 de abr. de 2019. Disponível em: <https://www.repsolsinopec.com.br/noticias/repsol-sinopec-brasil-lanca-desafio-da-digitali- zacao/>. Acesso em: novembro de 2021. Shell investe em projeto de desenvolvimento de startups capixabas: o Findeslab. Shell Brasil, Rio de Janeiro, 05 de set. de 2019. Disponível em: <https://www.shell.com.br/imprensa/comunicados-para-a-imprensa-2019/ shell-invests-in-espirito-santo-development-project-findeslab.html>. Acesso em: novembro de 2021. Webinar apresenta programas de inovação para empresas do setor de óleo e gás (24/8). Apex Brasil, Brasília, 24 de ago. de 2021. Disponível em: < https://portal.apexbrasil.com.br/noticia/webinar-apresenta-programas- de-inovacao-para-empresas-do-setor-de-oleo-e-gas-24-8/>. Acesso em: novembro de 2021. WORLD BANK. Global Economic Prospects. Disponível em: <https://open knowledge.worldbank.org/bitstream/ handle/10986/36519/9781464817601.pdf>. Acesso em: dezembro de 2021.#51Empty#52www.portaldaindustria-es.com.br in @obervatoriosideies FINDES IDEIES POR VOCÊ PELA INDUSTRIA, PELO ESPÍRITO SANTO Apoio: SEBRAE 4 Fórum Capixaba de Petróleo, Gás e Energia

Download to PowerPoint

Download presentation as an editable powerpoint.

Related

Q3 2020 Investor Presentation image

Q3 2020 Investor Presentation

Energy

New Fortress Energy Q3 2023 Investor Presentation image

New Fortress Energy Q3 2023 Investor Presentation

Energy

Helix Energy Solutions Company Update image

Helix Energy Solutions Company Update

Energy

2nd Quarter 2020 Investor Update image

2nd Quarter 2020 Investor Update

Energy

Helix Energy Solutions 2006 Annual Report image

Helix Energy Solutions 2006 Annual Report

Energy

Investor Presentation image

Investor Presentation

Energy

Investor Presentation image

Investor Presentation

Energy

Premium Rock, Returns, Runway 3Q 2022 Earnings image

Premium Rock, Returns, Runway 3Q 2022 Earnings

Energy